Benchmark Testing
Now the fun begins. All benchmark testing is done prior to taking the SSD apart if it has a heatsink, for pictures. Benchmarking is repeated several times to ensure proper results.
3DMark
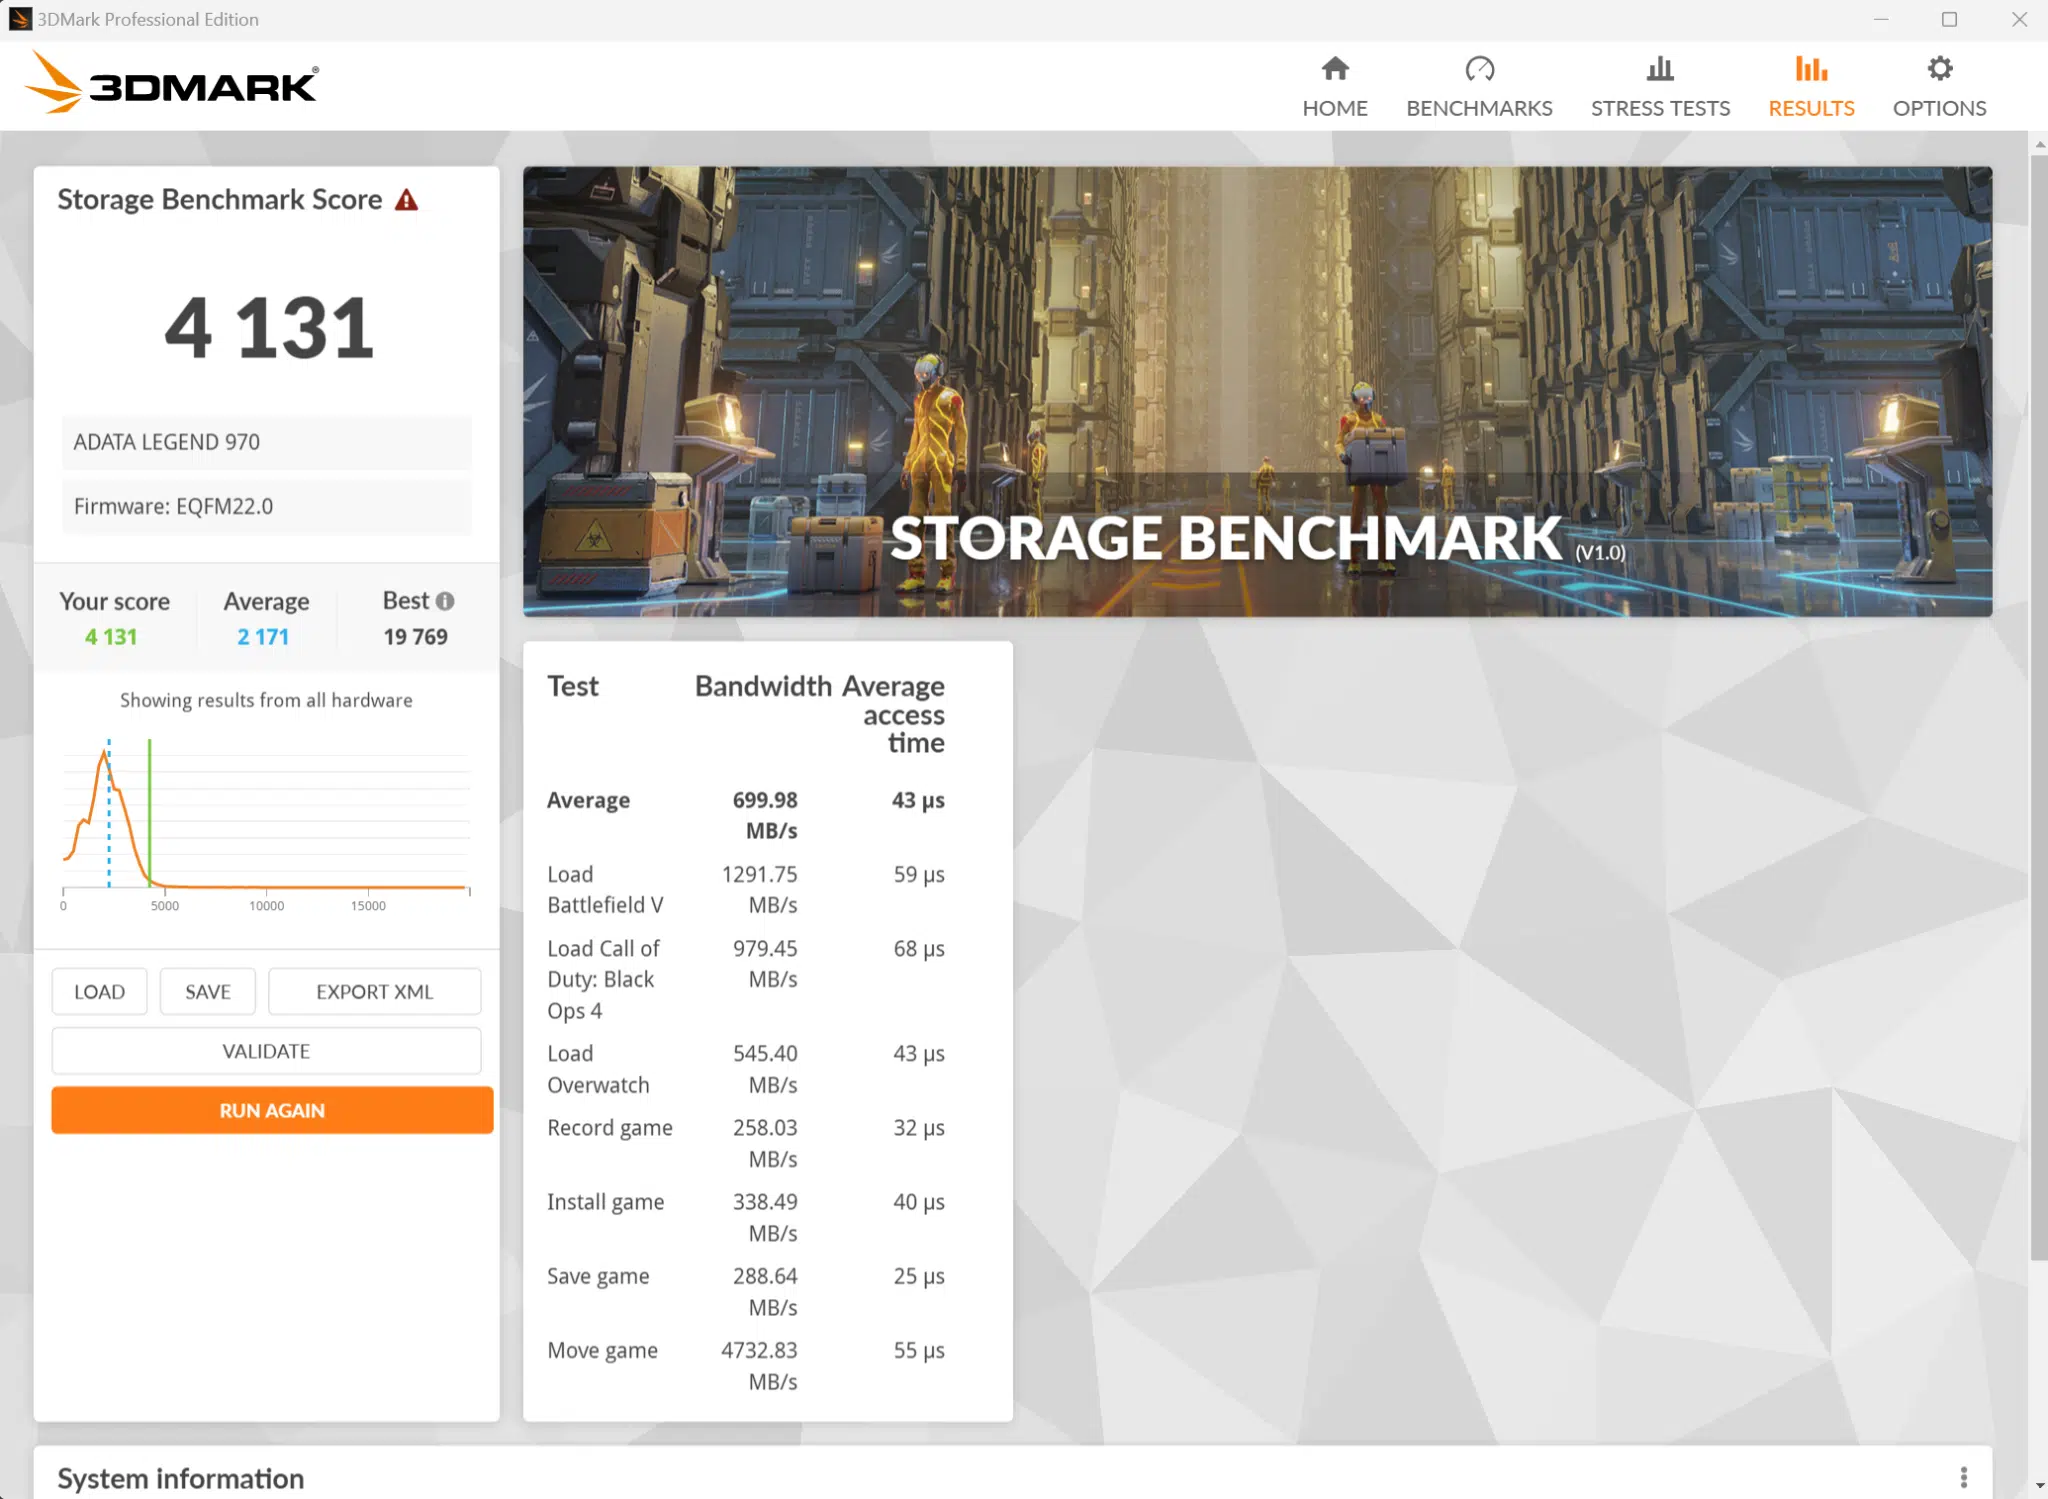
We use 3DMark’s Storage Benchmark which tests common gaming workload traces. The benchmark tests loading Battlefield V, Call of Duty Black Ops 4, and Overwatch. It tests moving games by copying a Steam folder for CS:GO, and installing Outer Worlds from the Epic Games Launcher, and saving game progress in The Outer Worlds. It tests recording a 1080p gameplay video at 60FPS with OBS while playing Overwatch. We graph the Overall Benchmark Score, and higher is better.
PCMark 10
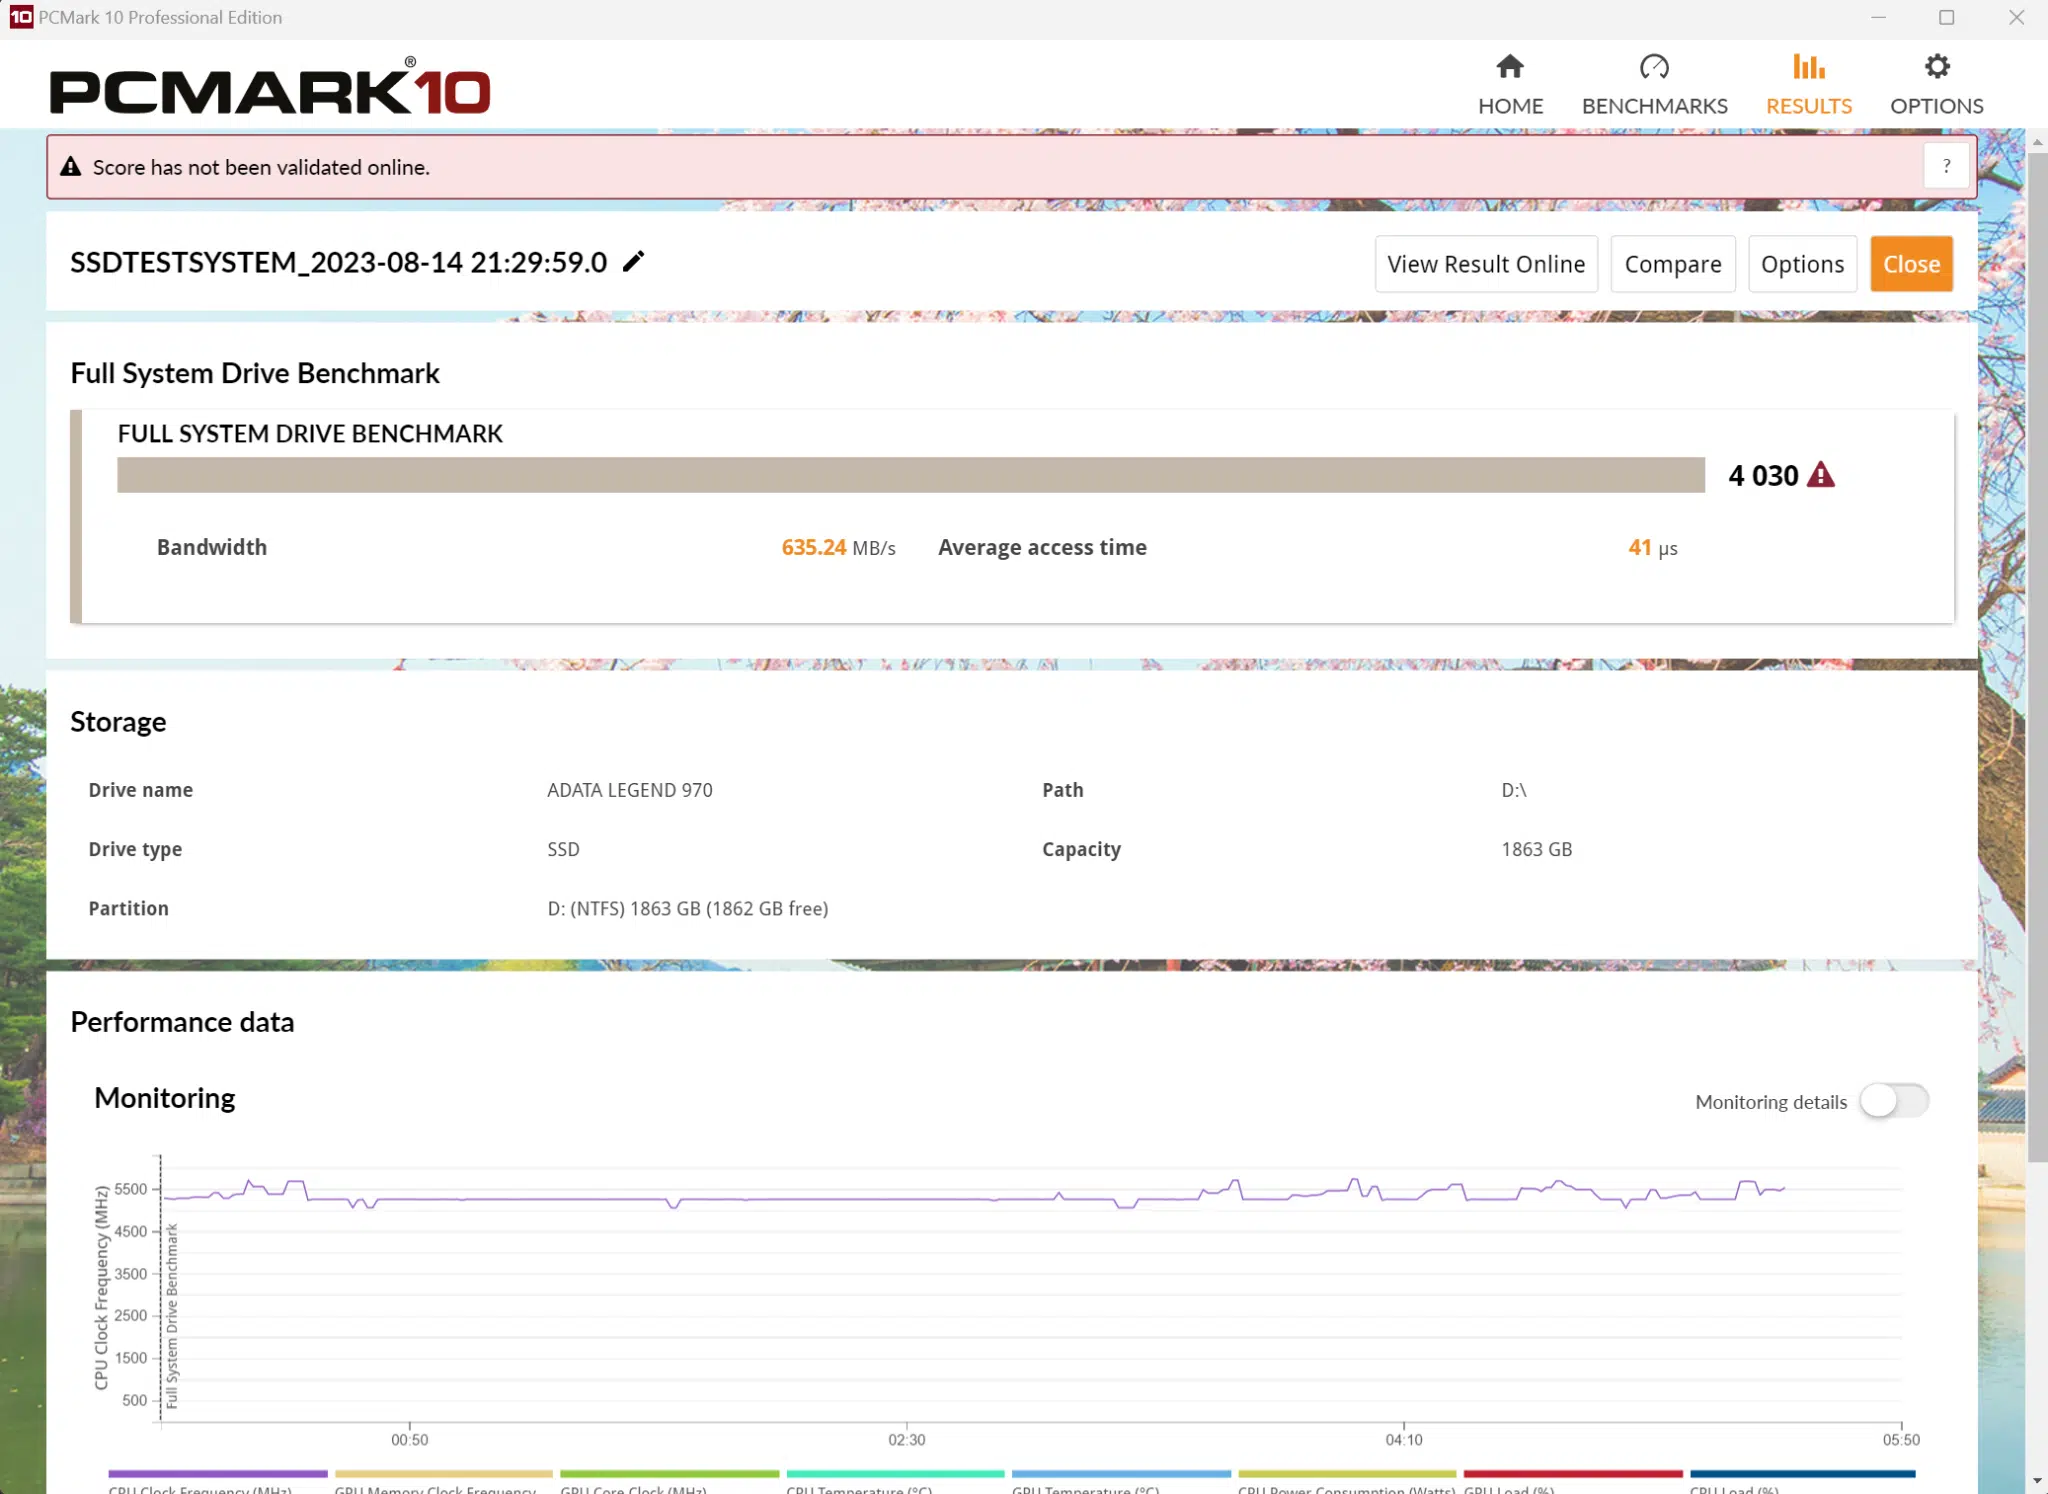
PCMark 10 is a powerful application benchmark for storage devices. It is a good overall application type benchmark for drives with real-world application traces. We use the full system drive benchmark. This takes a while to run. It uses many real-world traces from applications and common tasks to test performance. It uses 23 traces, running 3 passes with each trace.
The traces tested include: Booting Windows 10, Adobe Acrobat, Adobe After Effects, Adobe Illustrator, Adobe Premiere Pro, Adobe Lightroom, Adobe Photoshop, Battlefield V, Call of Duty Black Ops 4, Overwatch, Microsoft Excel, Adobe Illustrator, Adobe InDesign, Microsoft PowerPoint, Copying ISO images, and copying JPEGs.
We report the overall score, the bandwidth result, access time result. Higher scores are better, except for access time where lower is better. Note that the overall score is derived from the bandwidth result and access time result. There is a mathematical formula it uses to derive the score. The bandwidth score and access time are also derived from a formula. For example, Bandwidth is related to the amount of time that the storage device is executing I/Os. To learn more about this benchmark, check out the technical guide.
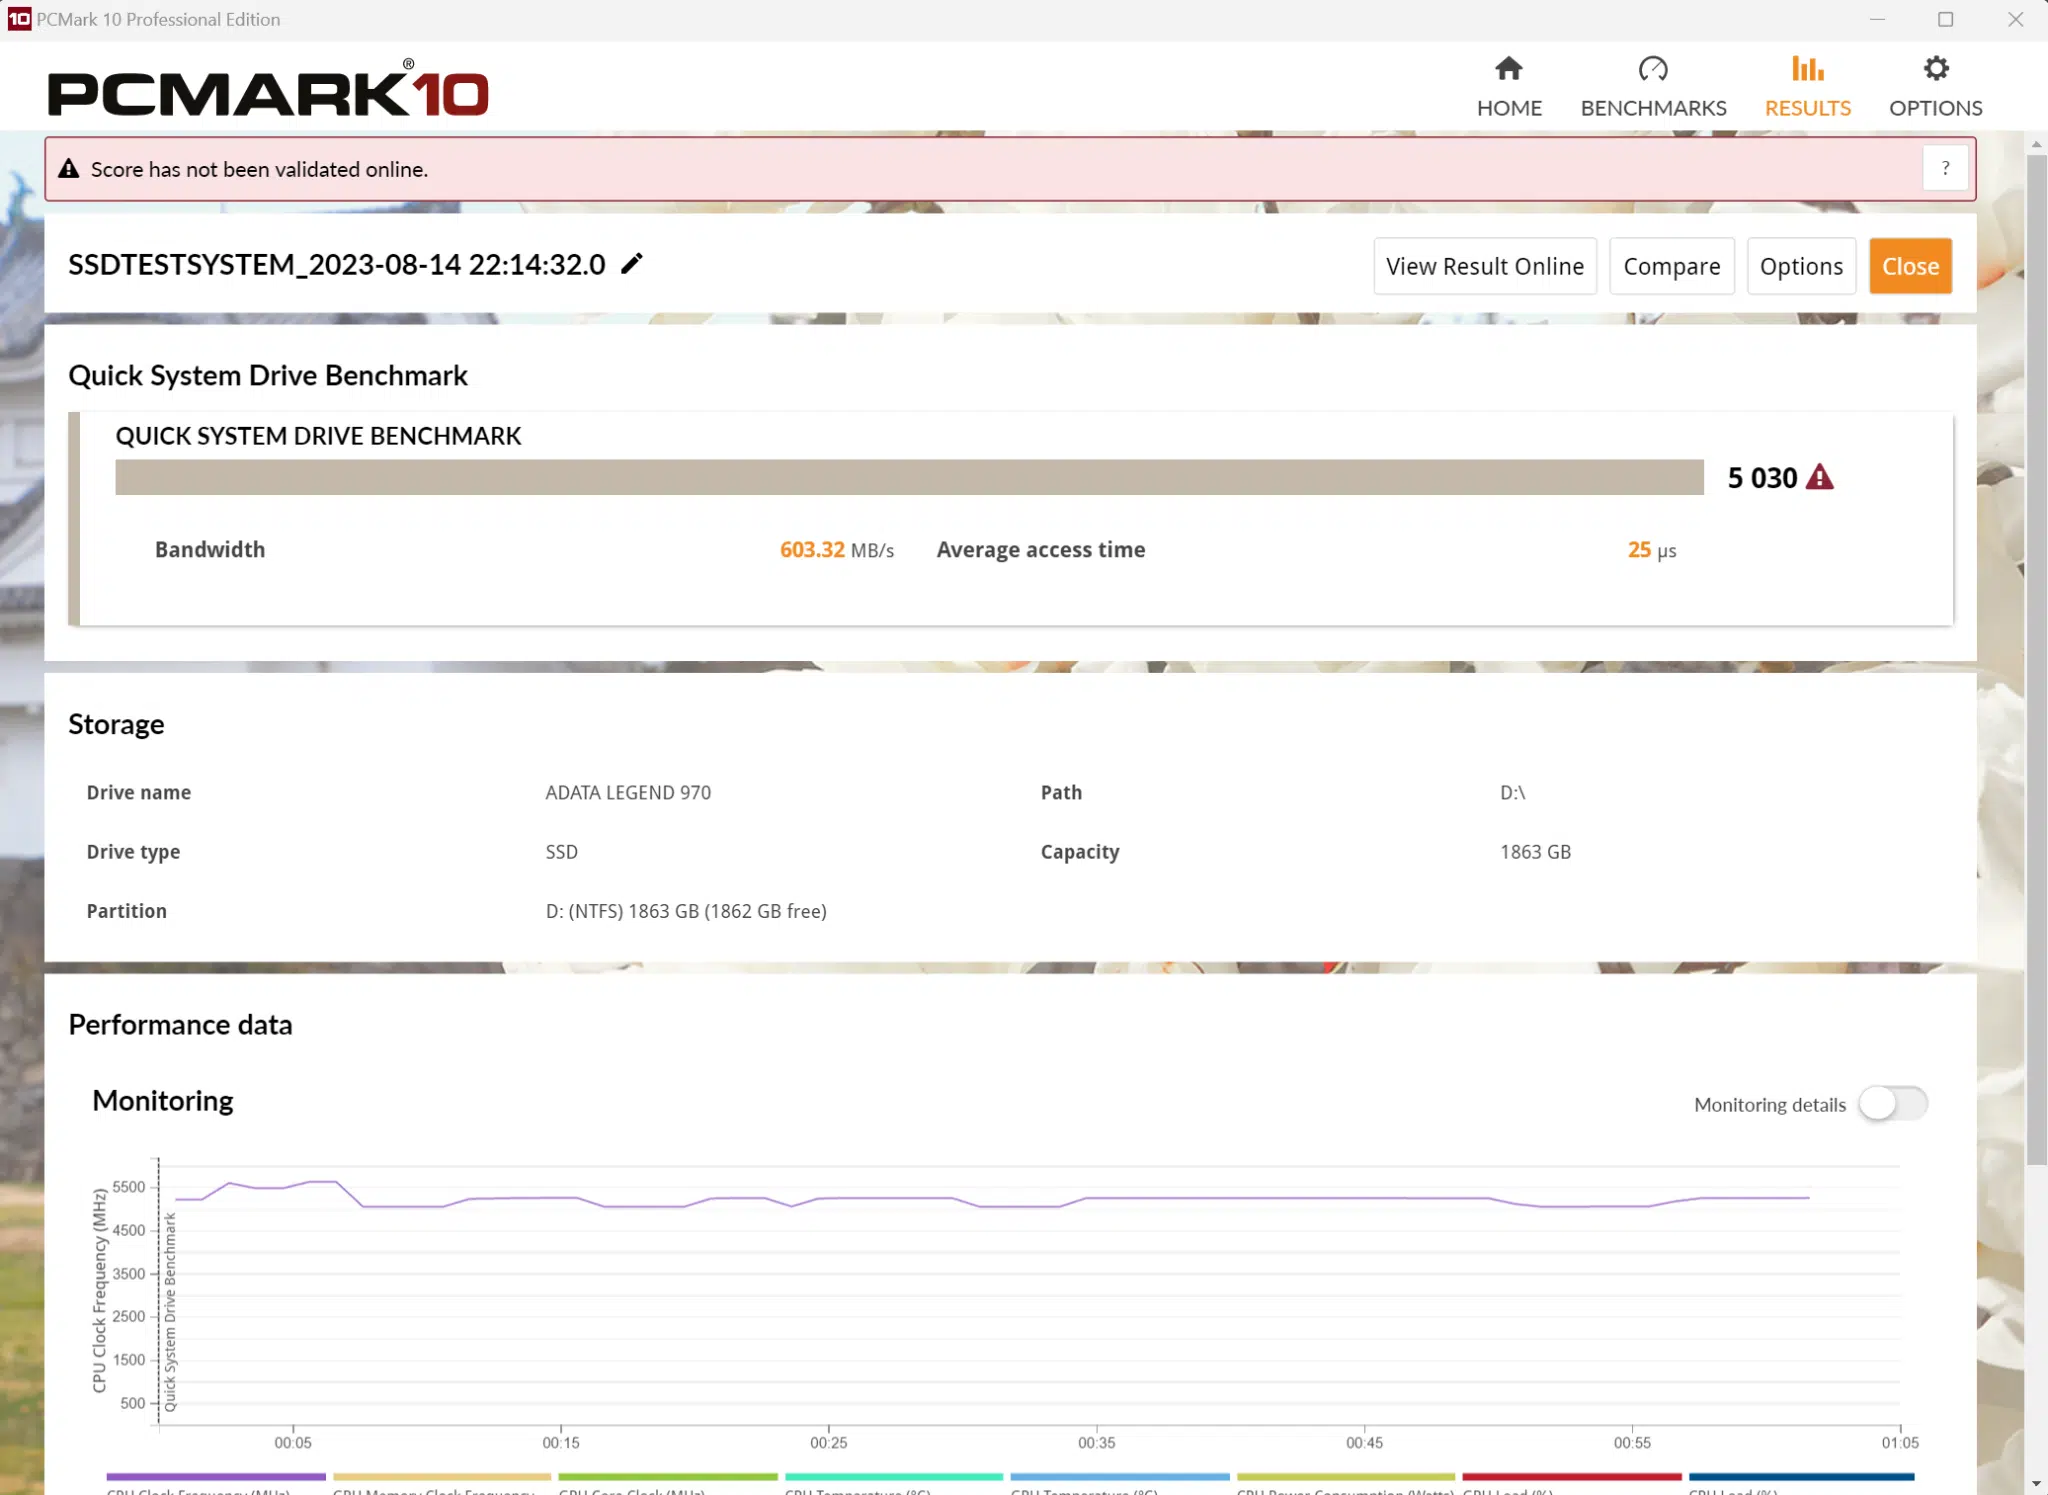
We also test with PCMark 10’s Quick Storage Benchmark, which utilizes a lighter workload of traces meant for smaller drives, but it also tests and emphasizes DRAM cache on SSDs, therefore it provides an interesting contrast to the wide-ranging test of the full benchmark above.
CrystalDiskMark
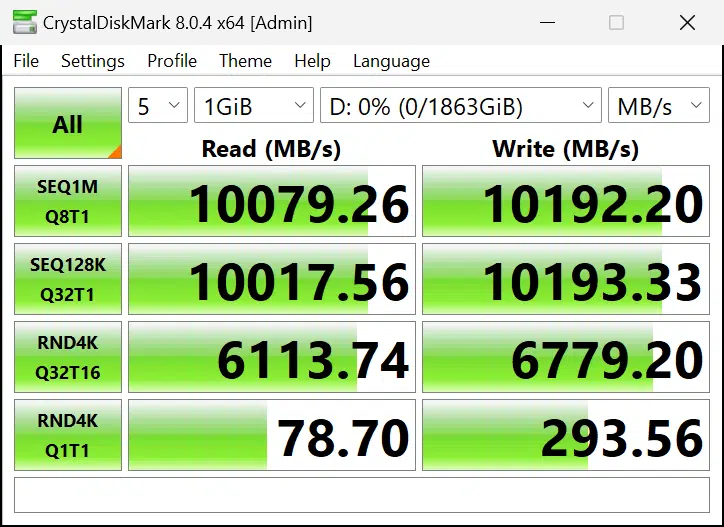
CrystalDiskMark is a common program for testing the throughput of sequential and random reads and writes. For NVMe drives, we use the NVMe profile in the program. For SATA drives we use the default profile. Therefore, you cannot compare results between SATA and PCI-Express drives as the testing configuration is different between both. But you can compare the results between PCIe Gen3 and Gen4 and Gen5 devices. We show the read-and-write results for each test, higher results are better.
The NVMe configuration tests SEQ1M Q8T1 read and write, SEQ128K Q32T1 read and write, RND4K Q32T16 read and write and RND4K Q1T1 read and write.
The default SATA configuration tests SEQ1M Q8T1 read and write, SEQ1M Q1T1 read and write, RND4K Q32T1 read and write and RND4K Q1T1 read and write.
Forspoken
We use the full retail game Forspoken, which supports DirectStorage to test game loading time. Forspoken was released on January 24th, 2023, on the PC and uses the Luminous Engine. We use an EVGA GeForce RTX 3060 XC BLACK GAMING 12GB video card. We enable the highest graphics settings, including Ultra High Texture Memory, and run at 1080p.
We use the built-in benchmark and report the scene load times. We add the sum of all seven scene load times and run the benchmark three times. We then take the average of the three sums from each run. We graph the average result.
Final Fantasy XIV: Endwalker Benchmark

We use Final Fantasy XIV: Endwalker Benchmark at 4K and Maximum settings, which benchmarks the load times of several game scenes. The benchmark calculates the sum load time of the scenes and reports the number. We run the benchmark three times, and take the average of the load times. This provides consistent, objective game load testing data we can use for comparison in a game scenario outside of DirectStorage.
DiskBench
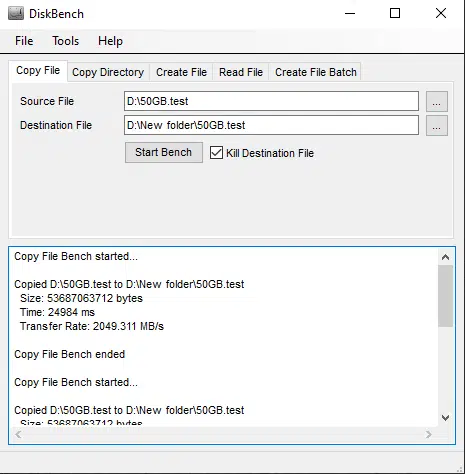
DiskBench is a utility we use to calculate the time it takes to copy a large file from the same drive being reviewed or tested to itself, volume to volume. We have created a 50GB file in Windows with the “fsutil” command. We place this file on the device being tested. We then tell DiskBench to copy this file on the drive to a new folder on the same drive. This tells us how good and fast the SSD is at copying large files. We report the duration of time it took to complete the task. Lower time is better.
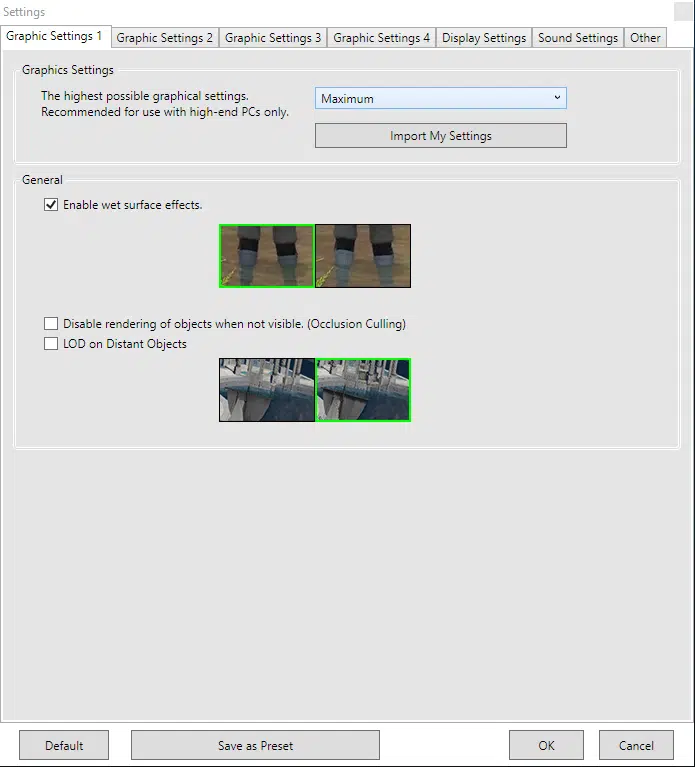
Since this is based on a real game and game engine, it has major relevance. For this benchmark, we set the graphics settings “Maximum” and the resolution to 4K. In this way, it is loading the highest texture sizes, and the most game assets to stress load times as much as possible. We graph the total average load time of all scenes. Lower time is better.
SPECworkstation 3.1
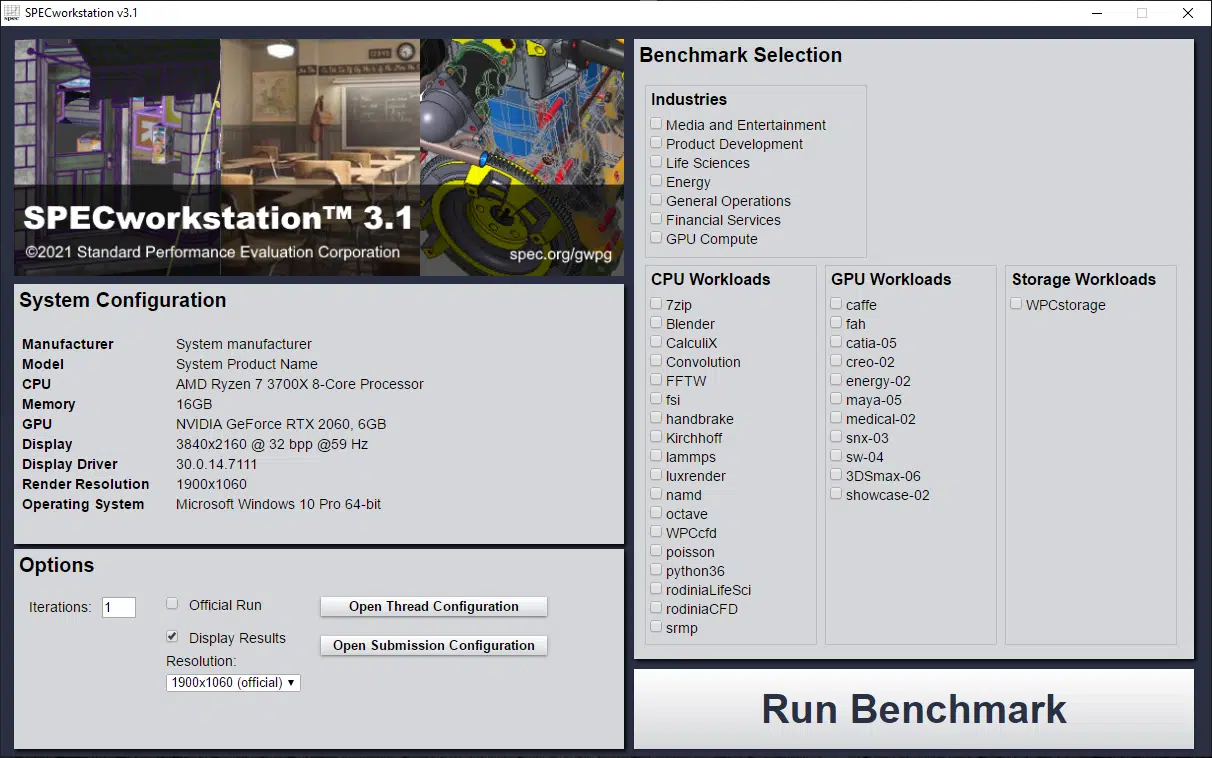
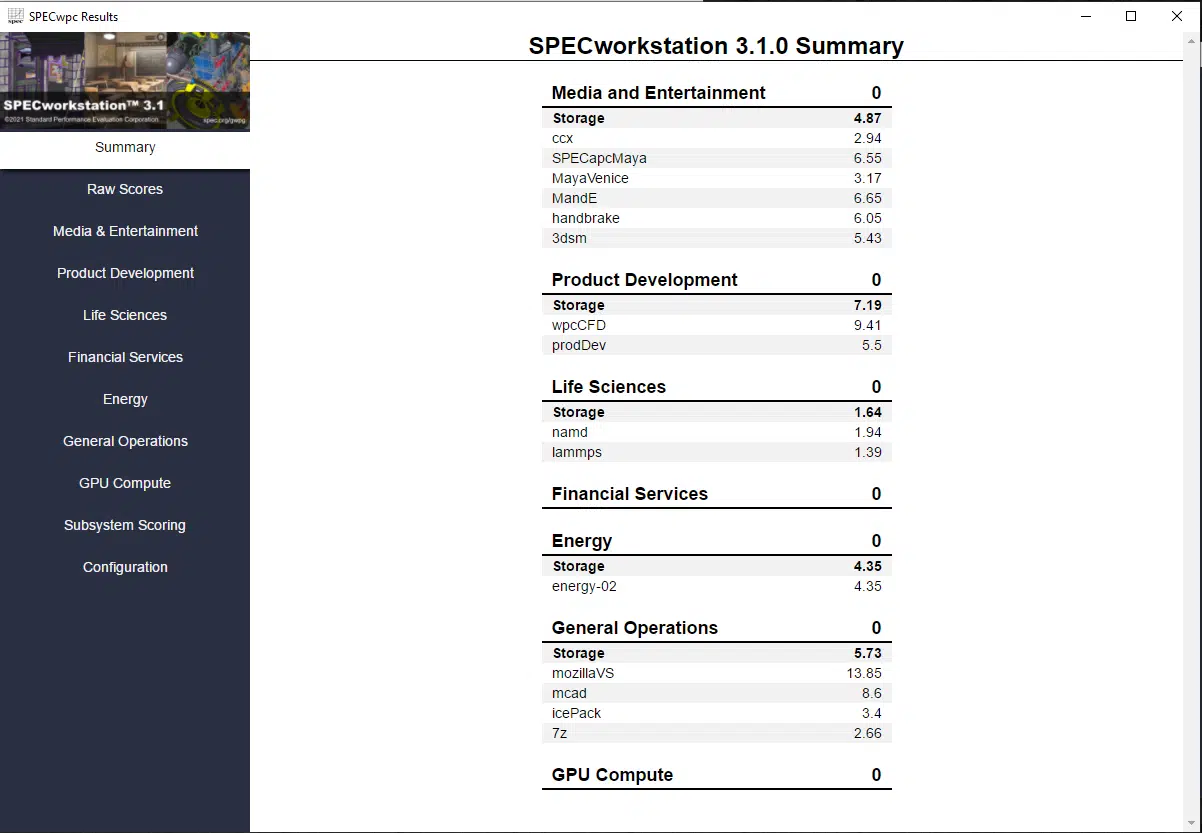
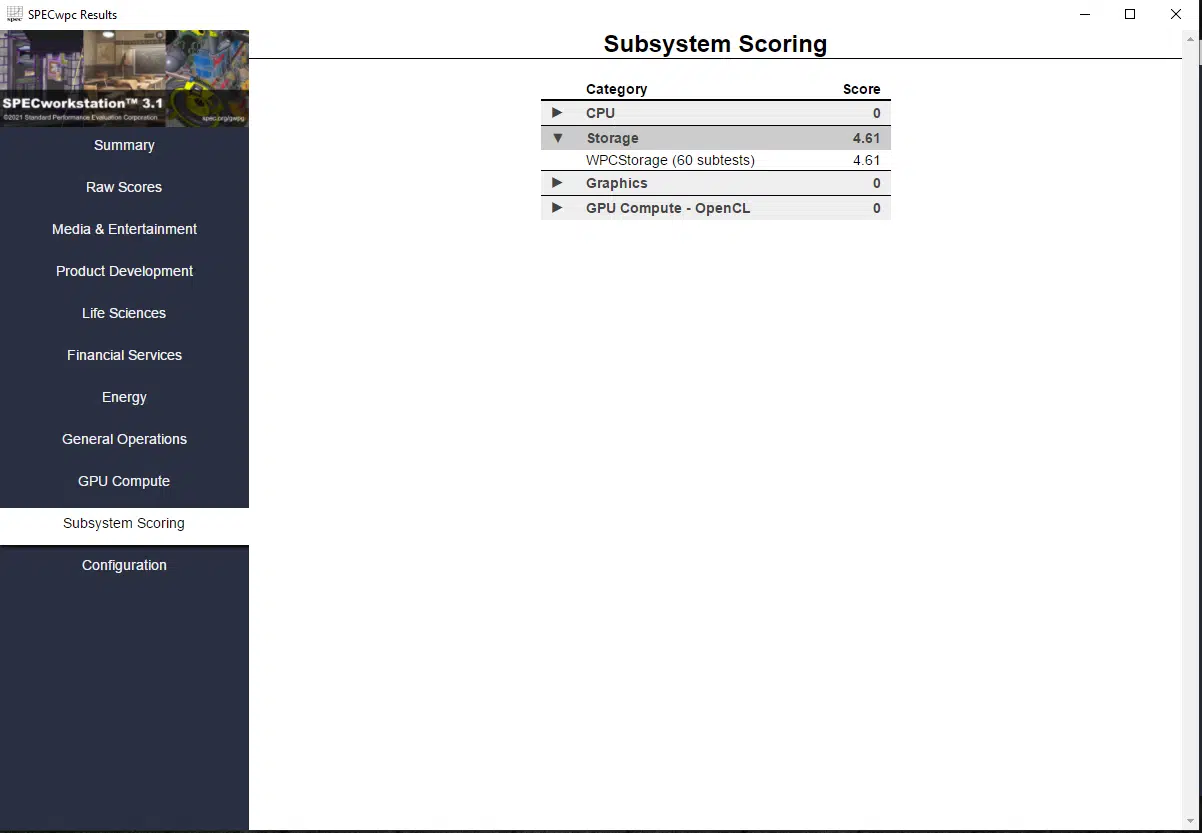
SPECworkstation 3.1 is a professional workstation benchmark based on diverse professional applications. We don’t run the entire benchmark, just the storage performance called WPCstorage. “The storage workload is based on storage transaction traces from a wide variety of professional applications engaged in real work. These are grouped according to market segments for scoring purposes.”
It runs 60 subtests of testing across different types of programs. The market segments it benchmarks are: Media and Entertainment, Product Development, Life Sciences, Energy, and General Operations. The entire list of applications are: ccx, SPECapcMaya, MayaVenice, MandE, handbrake, 3dsm, wpcCFD, prodDev, namd, lammps, energy-02, mozillaVS, mcad, IcePack and 7z.
It outputs an overall score for each section, and then an average score of everything combined. We graph the overall average score of everything combined and report that number. Higher numbers are better, and that means the SSD will perform better in workstation-class applications.
Temperature
We run only the Advanced Disk Testing portion of PassMark’s PerformanceTest. We run it with a 10GB file size for 20 minutes to stress test the SSD for temperature. We use HWiNFO to check the temperature and report the maximum or highest temperature.
Putting it all together
Beyond benchmarking, we also install and look at every feature of software associated with each manufacturer’s SSD. These toolboxes are great resources for managing your SSD, like updating firmware, doing Secure Erase or Wipe, optimizing features, overprovisioning, and checking disk health and lifespan. We examine these applications, take screenshots and show you what they have.
In the past, we have separated our performance graphs by speed generation or interface, for example, all SATA SSDs on one graph, and all PCIe Gen3 or Gen4 on separate graphs. While we will still do this between SATA and PCIe, as we move forward testing more Gen4 and Gen5 SSDs, we will place them on the same graphs up until we have enough PCIe Gen5 SSDs to fill up an entire graph. At that point, then Gen4 SSDs and Gen5 SSDs will reside by comparison on their own graphs.
In our graphs, just make sure to note underneath the SSD name the “Gen” number, we specify it in the product name on every graph, for every SSD so you know what PCIe Gen it is sitting at.
Through all of these tests and benchmarks, we should be able to derive a solid analysis of SSDs and report several different types of workloads. We will be able to tell which ones are better at what and relate our experiences to you to make good buying decisions.


Discussion
Join Discussion →No replies yet. Be the first to reply on the forum.