Synthetic Storage Benchmarks
PCMark 10
We are using PCMark 10’s Full System Drive Storage Benchmark. It outputs an overall score (higher is better) that is derived from the Bandwidth (higher is better) as well as access time (lower is better) results.
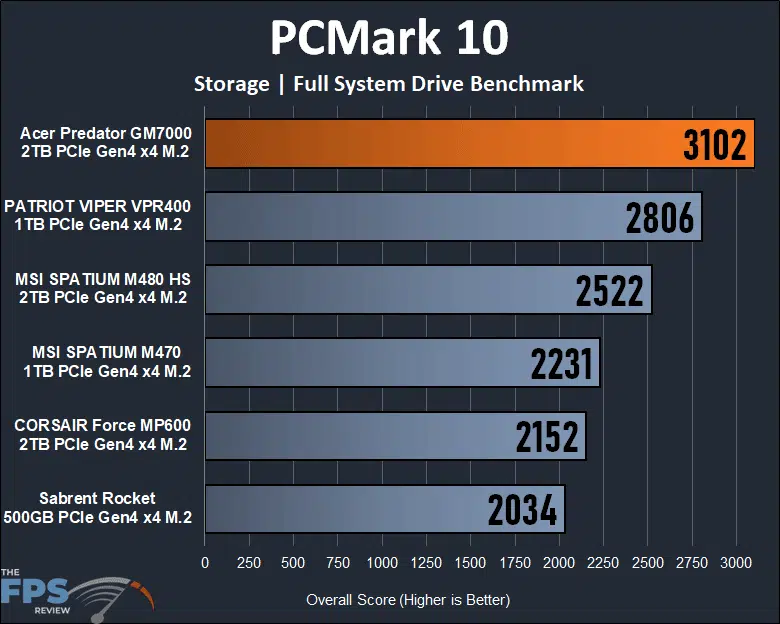
In PCMark 10’s full system drive storage benchmark, the Acer Predator GM7000 2TB NVMe PCIe Gen4 x4 SSD performs at the top of the charts compared to the other SSDs we have reviewed. It tops the chart with the highest overall score. At 3102 it is 11% faster overall compared to the previous fastest SSD we have reviewed, the PATRIOT VIPER VPR400 SSD. Compared to the CORSAIR Force MP600 it is 44% faster and compared to the MSI SPATIUM M480 it is 23% faster.
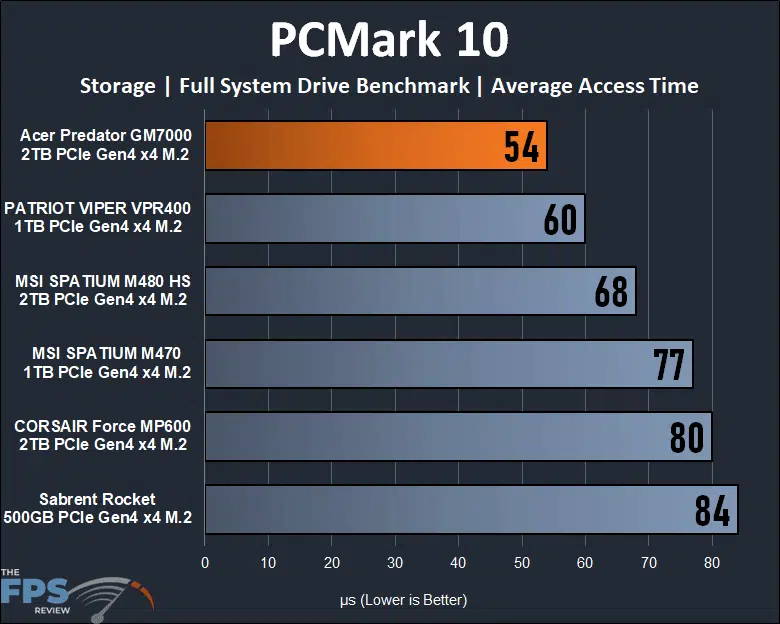
One of the reasons why the Acer Predator GM7000 SSD is so much faster in PCMark 10’s benchmark is the average access time. The Acer Predator GM7000 SSD has the best average access time we’ve encountered yet on an SSD in our lineup. Compared to the PATRIOT VIPER VPR400 it’s 10% better with access time. This is one quick SSD for access times.
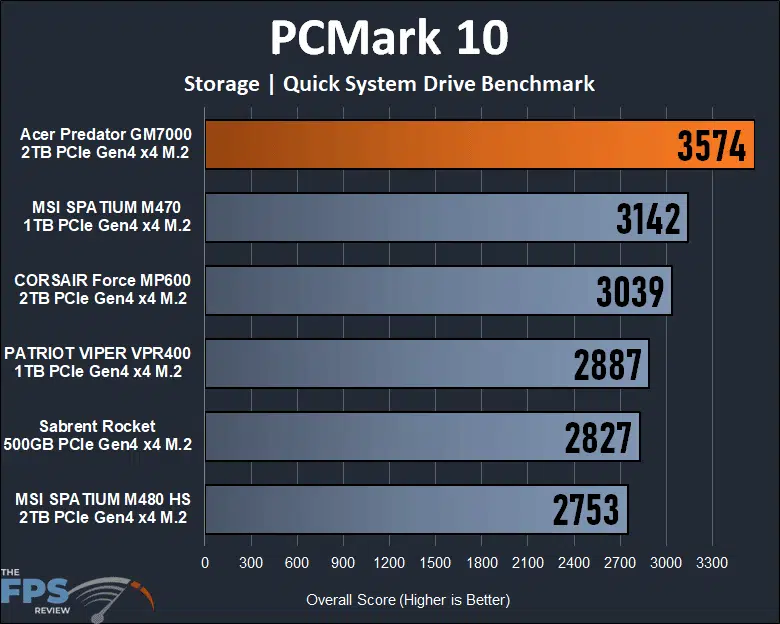
In the above graph, we are testing PCMark 10’s Quick Storage Benchmark, which utilizes a lighter workload of traces meant for smaller drives, it provides an interesting contrast to the wide-ranging test of the full benchmark above. In this test, which is utilizing lighter workloads, the Acer Predator GM7000 SSD is again at the top of the pack, which is 14% faster than the MSI SPATIUM M470, which used to be the fastest in this test. The improvement of the GM7000 over the rest is pretty impressive.
PassMark PerformanceTEST
We are using PassMark’s PerformanceTEST Disk Mark benchmark only. This test benchmarks Disk Sequential Read, Disk Sequential Write, IOPS 32KQD20, IOPS 4KQD1 tests and outputs an overall score (higher is better.)
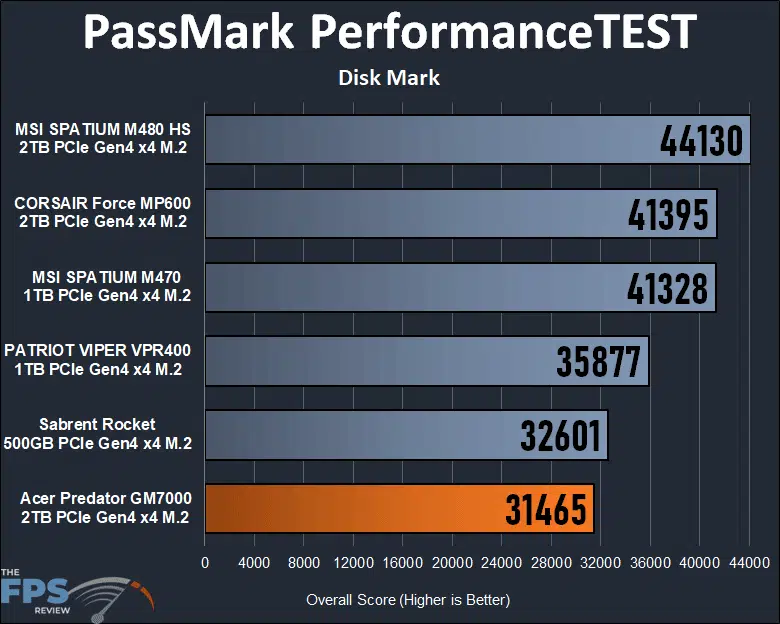
Now, in PassMark’s Performance TEST using the Disk Mark benchmark, it shows pretty much the opposite result compared to PCMark 10. In this benchmark, for some reason, the Acer Predator GM7000 is at the bottom of the pack. However, take this test with a grain of salt, as it is certainly the outlier compared to the rest of the benchmarks as you will see on the following pages. This one benchmark kind of stands out on its own, and doesn’t quite add up to the others. So just take this benchmark with a huge sack of salt, we are just including it for transparency.
Discussion (2 replies)
Join Discussion →I wonder if the limited cooling is affecting controller-intensive random writes.
Yep, I just ordered the 4TB one for my new laptop. Interesting coincidence since both are from the Acer Predator line.
I'll report on what speeds I see with it there, given that heat could be a much greater issue in it.