System Storage Benchmarks
For our SSD comparisons we are comparing similar PCIe Gen4x4 NVMe SSDs in this same performance tier of 7000MB/s read speed.
3DMark
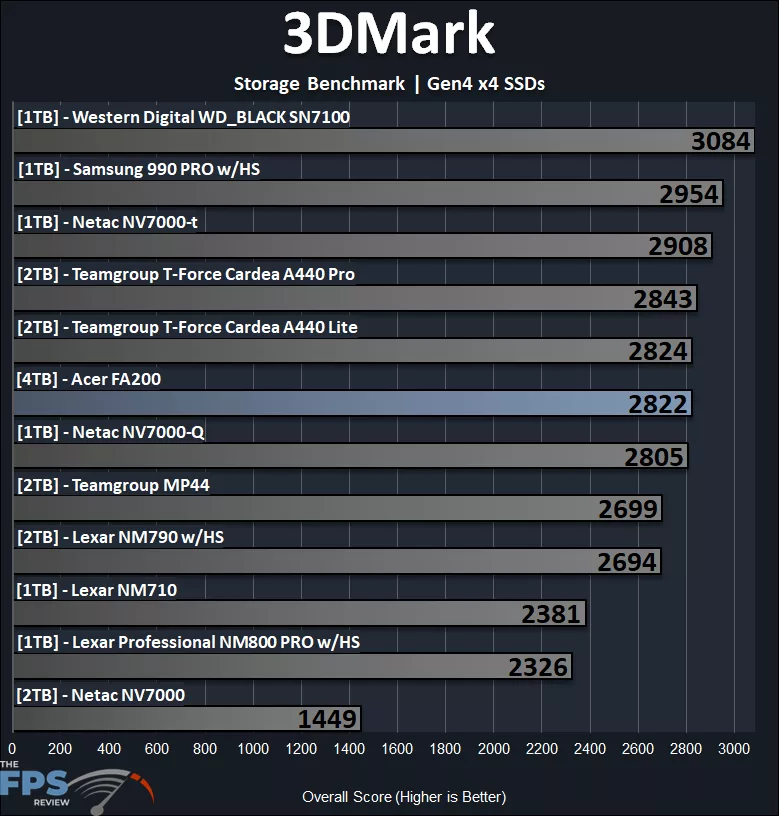
We are using 3DMark’s Storage Benchmark which tests common gaming workload traces. The benchmark tests loading Battlefield V, Call of Duty Black Ops 4, and Overwatch. It tests moving games by copying a Steam folder for CS:GO, and installing Outer Worlds from the Epic Games Launcher, and saving game progress in The Outer Worlds. It tests recording a 1080p gameplay video at 60FPS with OBS while playing Overwatch. We will graph the Overall Benchmark Score, higher is better.
In all of our benchmarks to follow, you’ll want to keep an eye on how the Acer FA200 4TB PCIe Gen4 M.2 NVMe SSD compares to the Netac NV7000-Q, because it as well is a QLC-based SSD on the Maxio MAP1602 controller and YMTC NAND flash. The Netac NV7000-Q will be a great comparison point, as it is a drive that closely matches the Acer FA200 in hardware.
In 3DMark’s storage benchmark, the Acer FA200 4TB PCIe Gen4 M.2 NVMe SSD pulls in with a total score of 2822, putting it in the middle of the pack for gaming performance. It actually just squeaks out over the Netac NV7000-Q, showing a very slight improvement over that QLC SSD. It can’t keep up with faster driers here, like the Western Digital, but again, the Acer FA200 4TB PCIe Gen4 M.2 NVMe SSD is a DRAM-less SSD, HMB, and QLC, and it is still hanging quite well. It is much faster than the Teamgroup MP44 and many other older SSDs.
PCMark 10
We are using PCMark 10’s Full System Drive Storage Benchmark. It outputs an overall score (higher is better) that is derived from the Bandwidth (higher is better) as well as access time (lower is better) results.
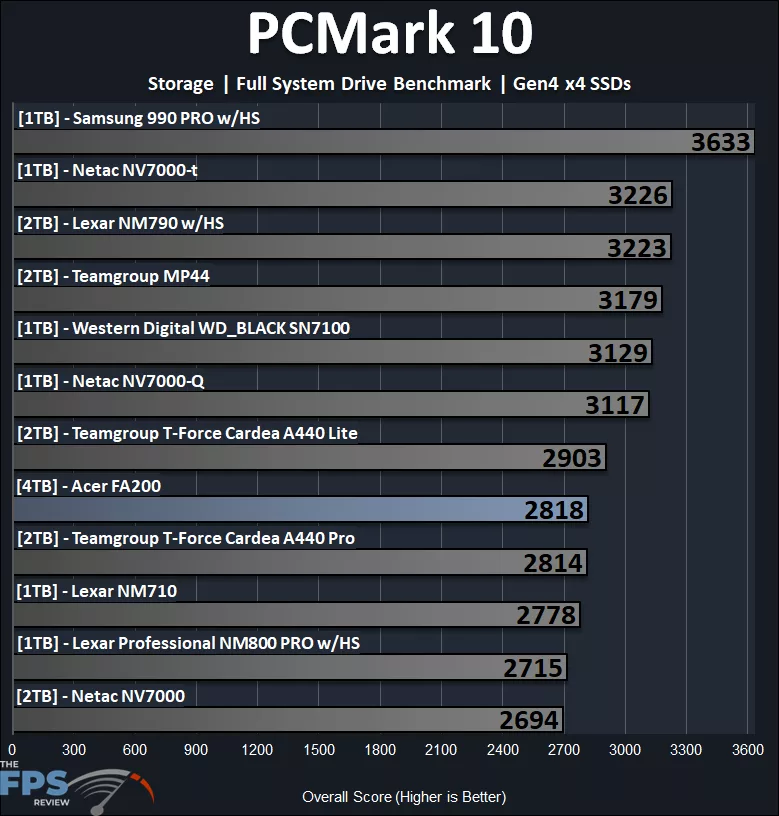
In PCMark 10’s full system drive storage benchmark, the Acer FA200 4TB PCIe Gen4 M.2 NVMe SSD pulls in a bit behind the Netac NV7000-Q overall. It does seem to be on par with the Teamgroup T-Force Cardea A440 Pro, which is an SSD with a DRAM cache, so that is impressive to see. There are SSDs that outperform it here, but it isn’t the slowest in this graph, with performance maintaining an overall average level of performance for general applications.
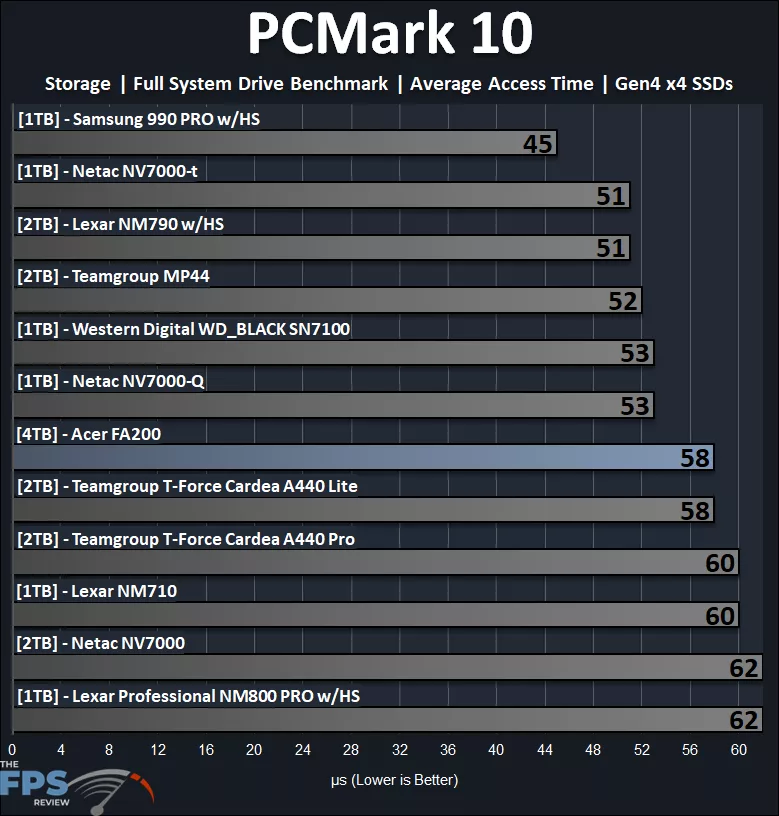
The average access time test in PCMark 10’s Storage Benchmark shows you a closer look at where things line up. This graph shows why the Acer FA200 4TB PCIe Gen4 M.2 NVMe SSD places a bit lower in PCMark 10; the access time is middling at 58, it’s not the worst, but there are certainly some that are better. With the access time being a bit slower than the Netac NV7000-Q, the overall PCMark 10 score becomes lower in the graph above. We can see that it has equal access time with the Teamgroup T-Force Cardea A440 Lite, and actually beats the Teamgroup T-Force Cardea A440 Pro on access time.
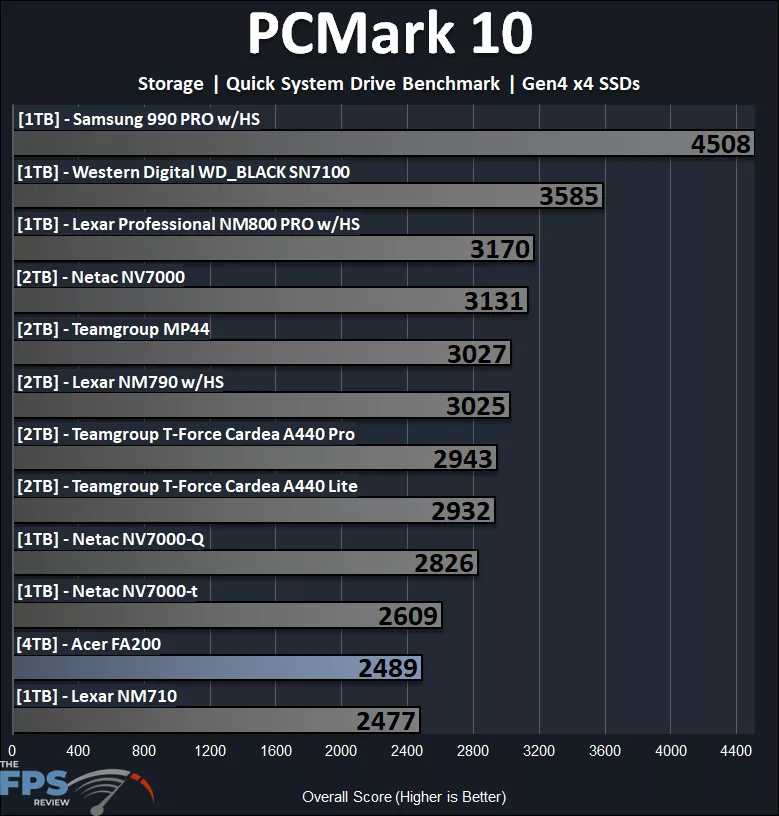
PCMark 10’s quick system drive storage benchmark focuses on smaller workloads, and typically this is where we see the benefit of a DRAM cache. This is where the Acer FA200 4TB PCIe Gen4 M.2 NVMe SSD shows its lack of DRAM buffer, with a score of 2489, it is near the bottom for smaller workloads. Note that even the Netac NV7000-Q suffers here, so it is likely a combination of the controller and lack of a DRAM cache, combined with latency and access time.
PassMark PerformanceTEST
We are using PassMark’s PerformanceTEST Disk Mark benchmark only. This test benchmarks Disk Sequential Read, Disk Sequential Write, IOPS 32KQD20, IOPS 4KQD1 tests and outputs an overall score (higher is better.)
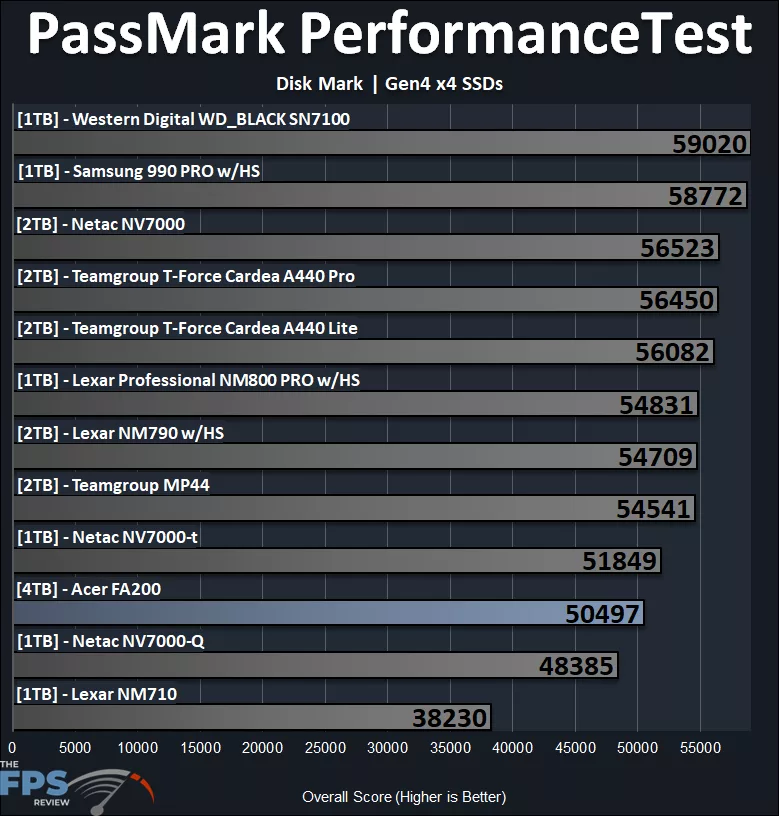
In PassMark PerformanceTest Disk Mark, this benchmark takes everything into consideration, small workloads, large workloads, access time, and DRAM cache, and this benchmark kind of backs up PCMark 10’s quick storage test. The Acer FA200 4TB PCIe Gen4 M.2 NVMe SSD is near the bottom once again, at 50497. However, this time it does actually beat the Netac NV7000-Q by 4%, which is actually encouraging to see. Perhaps NVMe 2.0 makes a difference?