Performance and Conclusion
Performance Graph
Here we go, this is our one graph of performance we have right now. This graph contains eight video cards compared at apples-to-apples settings in this game. The video cards are organized from fastest to slowest.
The game version being tested is 1207.60. We are using the game’s built-in benchmark found under the graphics setting menu. Holding down X starts the benchmark run. This game’s benchmark is the most real-world benchmark we’ve ever seen. It does a run-through that we’d chose to do a real-world manual run-through of. It does it exactly like we would do it as a gamer, so it really does represent this game’s performance well.
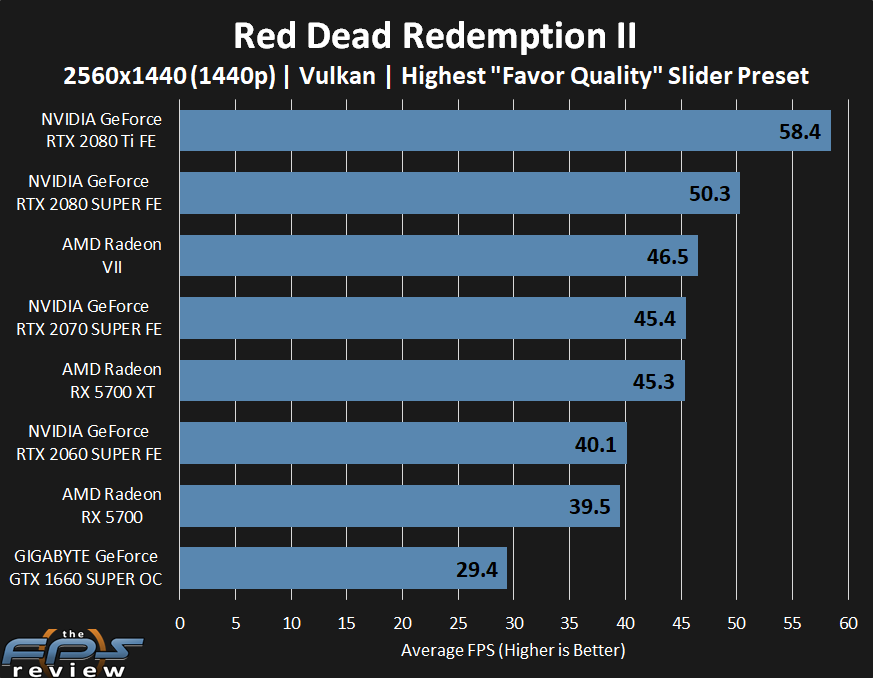
In the graph above we are testing the game at 1440p with the highest slider setting of “Favor Quality.” The first thing you will notice is how demanding the graphics are since no video card is actually able to reach an average of 60FPS.
Even the GeForce RTX 2080 Ti FE, the fastest video card we have here doesn’t even hit 60FPS average. It comes very close, but it is just right under 60FPS average. Keep in mind that this isn’t even the highest graphics settings the game supports.
Otherwise, the video cards like the GeForce RTX 2070 SUPER and Radeon RX 5700 XT are neck-and-neck, but ultimately not playable at this setting. You will have to lower settings at 1440p to make them playable. The video cards below that seem to be best suited for 1080p in this game.