Gaming Benchmarks
These benchmarks do not represent real-world gameplay by any stretch of the imagination. These tests are conducted using built-in benchmarking tools utilizing the game engine. These tests are designed to stress the CPU’s power system as well as ensure proper functionality. These are all run at CPU limited resolutions to try our best to remove the video card as a bottleneck.
One additional note about gaming performance is that these are average values. They do not tell the whole story. Specifically, Destiny 2’s low’s and high’s help tell a very different story than what the average reports are. Fortunately, while the lows are considerably lower than that of Intel CPU’s, the amount of frames that drop into the lowest range are extremely few.
As stated in previous articles, we are transitioning to providing more comprehensive data for gaming benchmarks. Leveraging some of the built-in tools, we are showing minimums, averages, and maximum frame rates. Frametimes are something we will work on including in the future as well. Unfortunately, we didn’t have that much lead time from Intel on this review.
3DMark 10
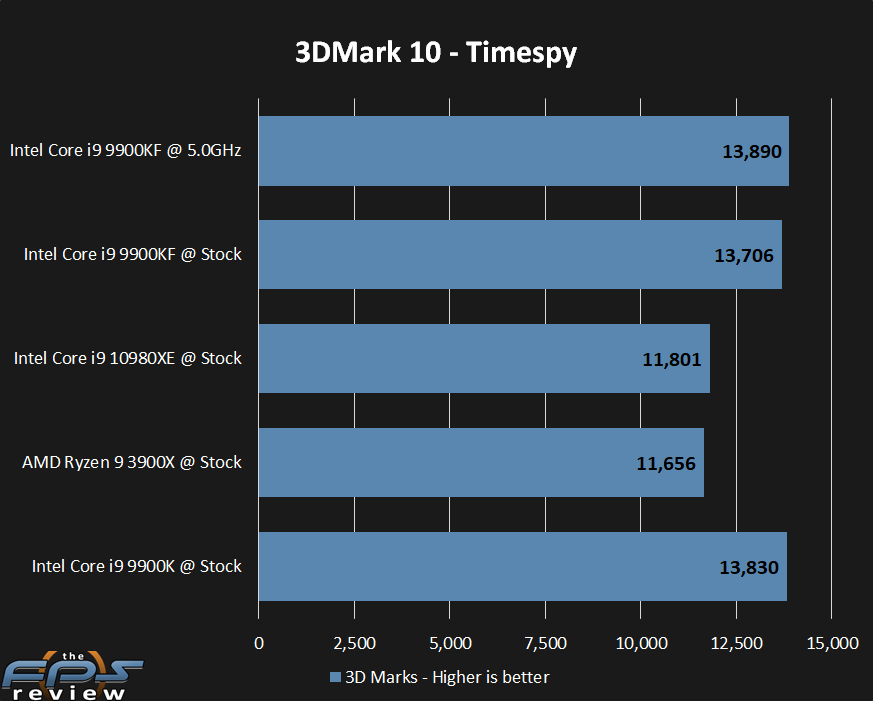
This is one case where additional cores don’t really help a whole lot. The 9900K and KF do better here than our other examples. Overclocking doesn’t do much, but it does increase the score slightly.
Heaven
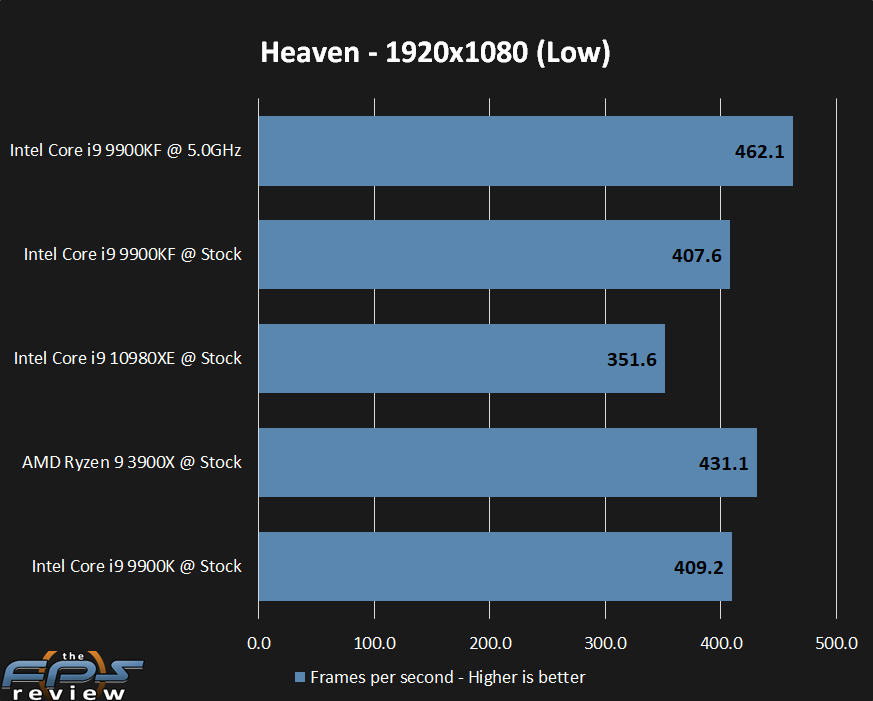
This is a test where clock speed makes all the difference, and we can see that with our overclocked 9900KF.
Shadow of the Tomb Raider
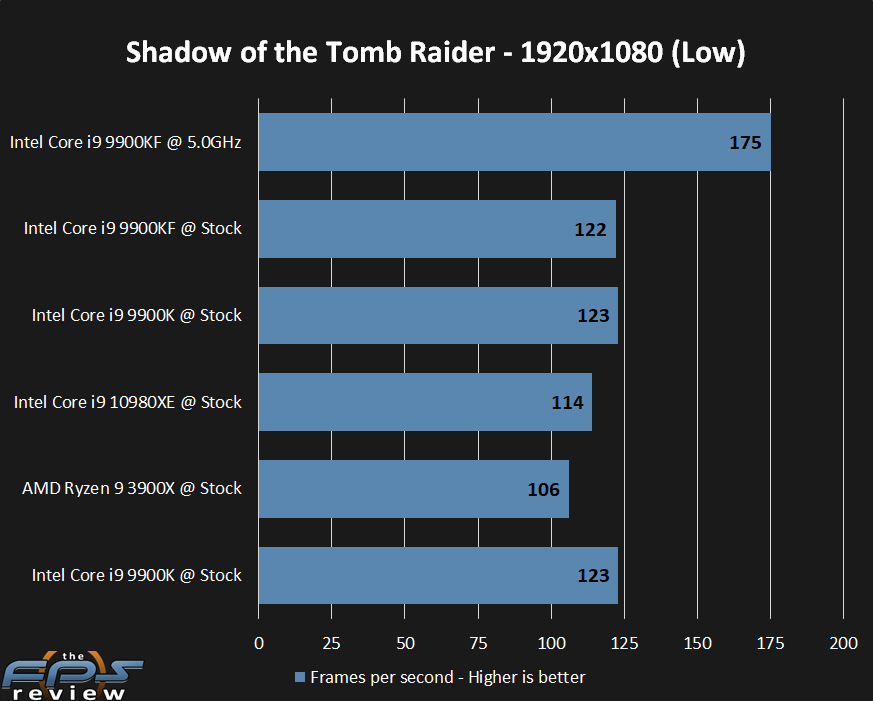
This is one case where the overclocked value surprised the hell out of me. I ran the test multiple times, and this was the result. It’s a bit of an aberration for sure.
Hitman 2 (2019)
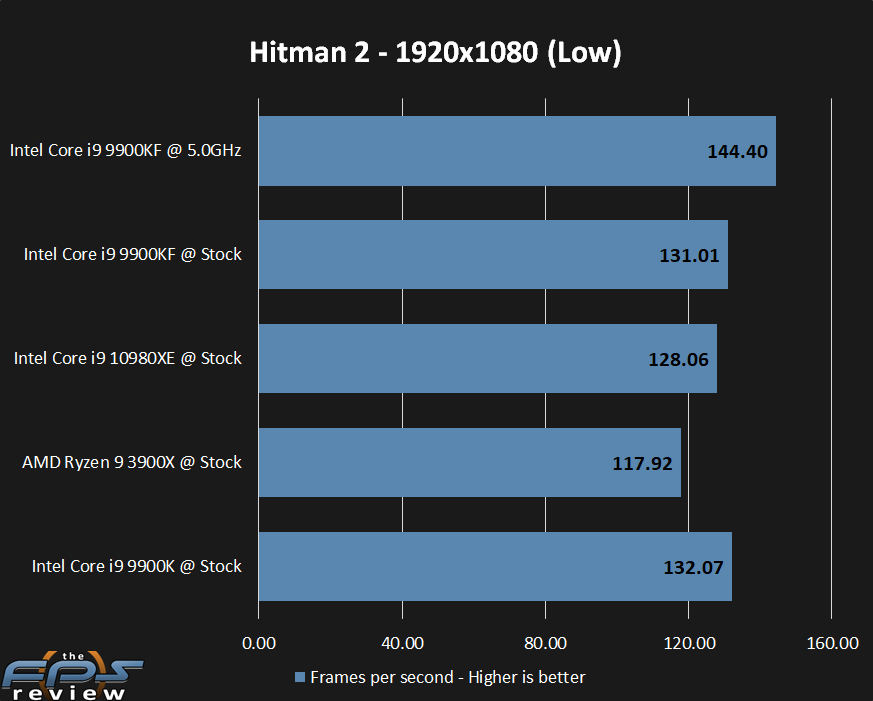
The results mirror many of the other tests with an overclock helping a fair amount.
Destiny 2
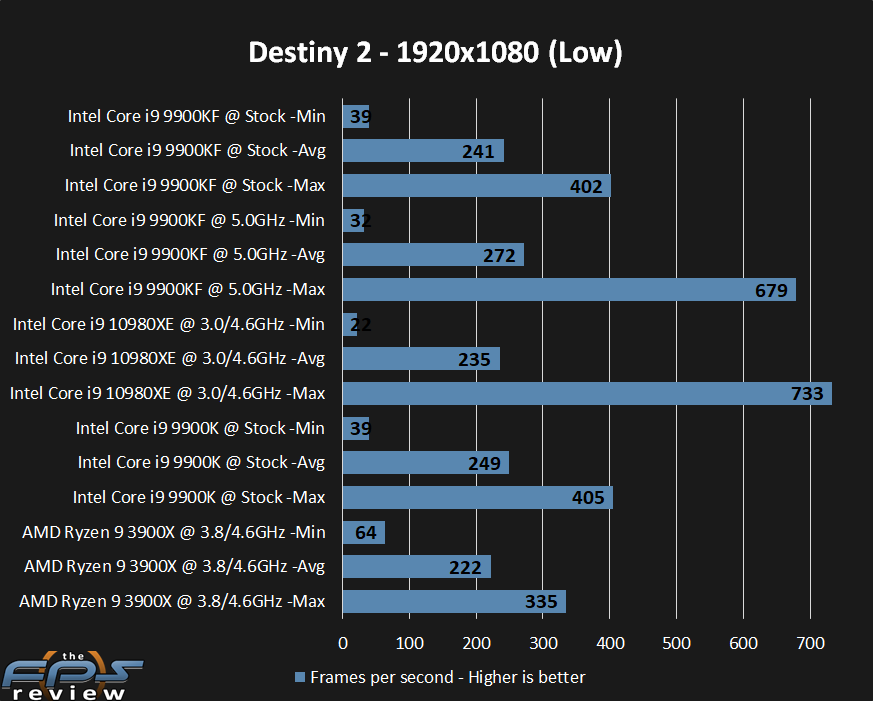
The results between the 9900KF and 9900K are so close that there really is no difference. Overclocked, things change dramatically. Minimums didn’t change much, but the average and maximum frame rates certainly did.