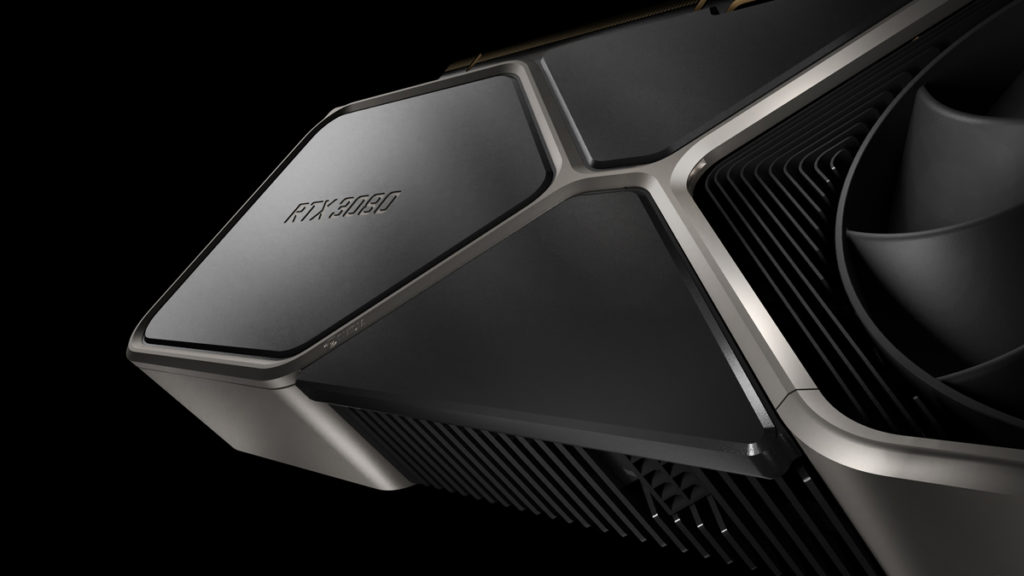
Compute-performance metrics for the NVIDIA GeForce RTX 3080 have made their way onto Geekbench, and just like yesterday’s CompuBench numbers, the results are positively inspiring. The flagship gaming GPU managed an OpenCL score of 191,891, which is 43 percent better than the TITAN RTX (134,369). That also happens to be 46, 74, and 86 percent better than the GeForce RTX 2080 Ti (131,494), GeForce RTX 2080 SUPER (110,399), and GeForce RTX 2080 (102,969), respectively.
According to 3D Center, which provided the comparison charts below, the GeForce RTX 3080’s OpenCL score translates to 29.77 teraflops of FP32 (32-bit floating point) computing power. NVIDIA had previously confirmed that the RTX 30 Series’s streaming multiprocessors provide twice the throughput for such operations (note the doubling of CUDA Core counts in their specification sheets).
As we pointed out yesterday, compute performance doesn’t necessarily equate to gaming performance, but the GeForce RTX 30 Series seems to look better by every passing day. Assuming that you can beat the scalper bots, the GeForce RTX 3080 Founders Edition will be available starting on September 17 for $699.
| Hardware | GB5 OpenCL | Annotation | (GB5 CUDA) | |
|---|---|---|---|---|
| GeForce RTX 3080 | Ampere, GA102, 68 SM @ 320 Bit GDDR6X | 191’891 | +86% vs. 2080, +74% vs. 2080S, +46% vs. 2080Ti | (215’361) |
| GRID V100S-32Q | Volta, GV100, 80 SM @ 4096 Bit HBM2 | 153’272 | – | – |
| Titan RTX | Turing, TU102, 72 SM @ 384 Bit GDDR6 | 134’369 | – | (143’168) |
| GeForce RTX 2080 Ti | Turing, TU102, 68 SM @ 352 Bit GDDR6 | 131’494 | +28% vs. 2080, +19% vs. 2080S | (162’452) |
| GeForce RTX 2080 Super | Turing, TU104, 48 SM @ 256 Bit GDDR6 | 110’399 | +7% vs. 2080 | (125’433) |
| GeForce RTX 2080 | Turing, TU104, 46 SM @ 256 Bit GDDR6 | 102’969 | – | (119’746) |
| GB5 OpenCL | FP32-Power | OpenCL/FP32 Efficiency | |
|---|---|---|---|
| GeForce RTX 3080 | 191’891 (186%) | 29,77 TFlops (296%) | 63% efficient |
| GeForce RTX 2080 Ti | 131’494 (128%) | 14,23 TFlops (141%) | 91% efficient |
| GeForce RTX 2080 Super | 110’399 (107%) | 11,15 TFlops (111%) | 96% efficient |
| GeForce RTX 2080 | 102’969 (100%) | 10,07 TFlops (100%) | Base Value: 100% |
