Throughput Benchmarks (SEQ and RND)
CrystalDiskMark
We are using CrystalDiskMark to benchmark sequential and random throughput of read and write performance. For these NVMe SSDs we are using the NVMe profile in CrystalDiskMark. This tests SEQ1M Q8T1, SEQ128K Q32T1, RND4K Q32T16, and RND4K Q1T1.
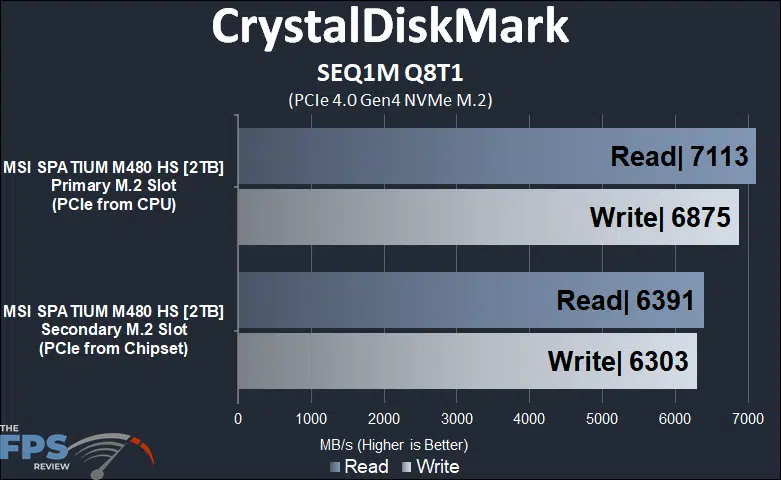
Ok, now these are much larger differences, and quite a bit more than we expected. In CrystalDiskMark we are looking at sequential read and write performance, and this is where the Secondary M.2 socket coming off the chipset lets us down big time. There is a read throughput loss of a whopping 10% or 700MB/s. There is a write throughput loss of 8% or 500MB/s. These are significant performance differences when talking about fast NVMe 1.4 drives like these, just from being in a different socket, even though both support PCIe 4.0 x4.

The trend continues in the SEQ128K Q32T1 test, with read throughput being 5% slower and write performance being 7% slower on the Secondary M.2 socket. This is significant.
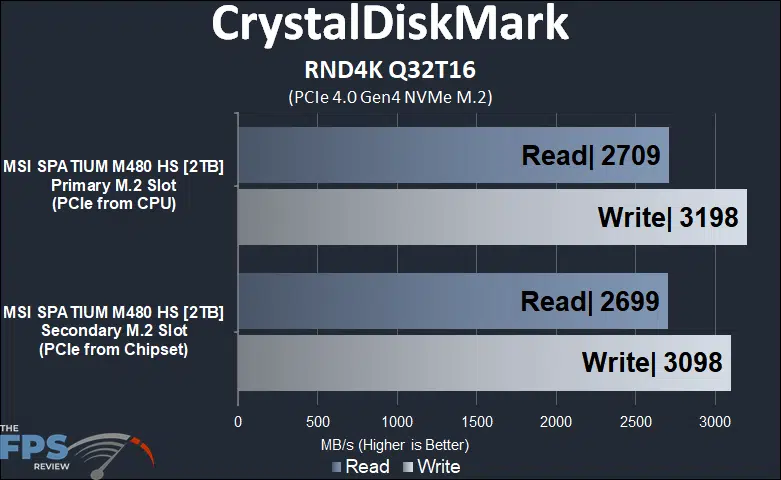
The trend continues on random read and write testing, though it is not as severe, there is still a loss on the secondary M.2 socket.

There is a larger loss on the write performance for random 4K Q1T1 testing on the Secondary M.2 socket. Write performance drops 13% which is very significant.