Synthetic Benchmarks
3DMark Time Spy is a benchmark that needs no introduction for the PC enthusiast community. This benchmark is gradually being replaced with the newer 3DMark Port Royal, but as of right now it’s still being used by many PC community members as a performance tool. Make no mistake about it either, Time Spy can still prove to be a solid indicator of potential video card performance.
3DMark Time Spy
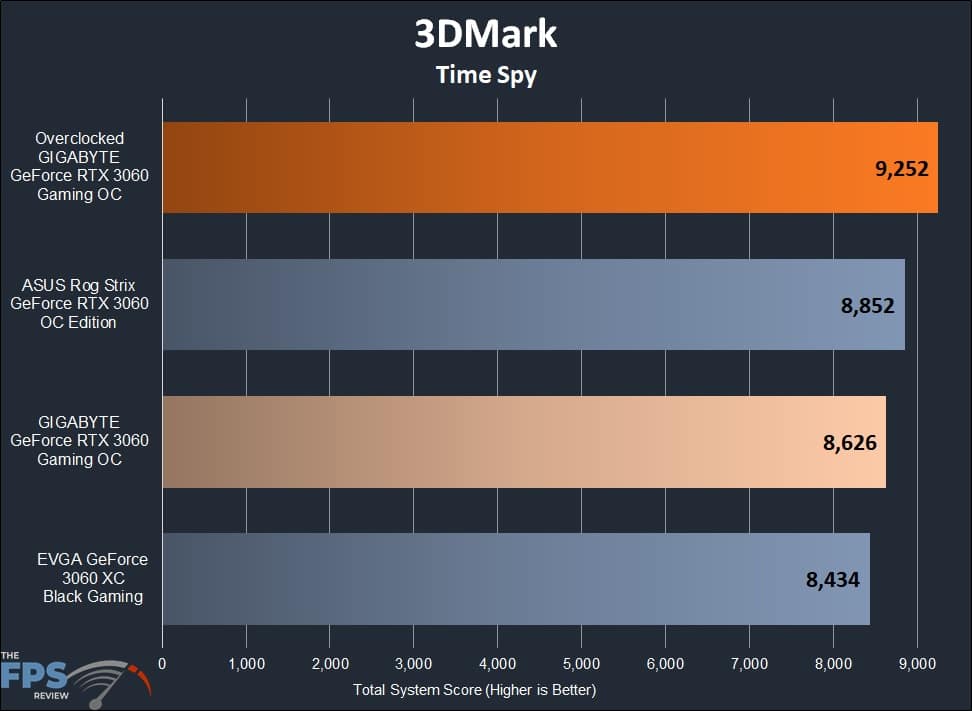
Looking at our results, we see that our GIGABYTE card sits in the middle of the pack when left at stock. It manages to best the EVGA card by 2.2% while falling behind the ASUS card by 2.5%. This is a fairly close spread, and no card here commands an overwhelming lead. When we turn on the overclock, things change, with the GIGABYTE card now leading the pack. It now ends up 4.4% faster than the ASUS card and 9% faster than the EVGA card. These results compare favorably against our overclocked ASUS and EVGA test scores. The GIGABYTE card is 2.17% faster than our overclocked ASUS card, which managed a score of 9053. It is also faster than our overclocked EVGA card that managed a score of 8952 which is 3.2% slower.
3DMark Port Royal
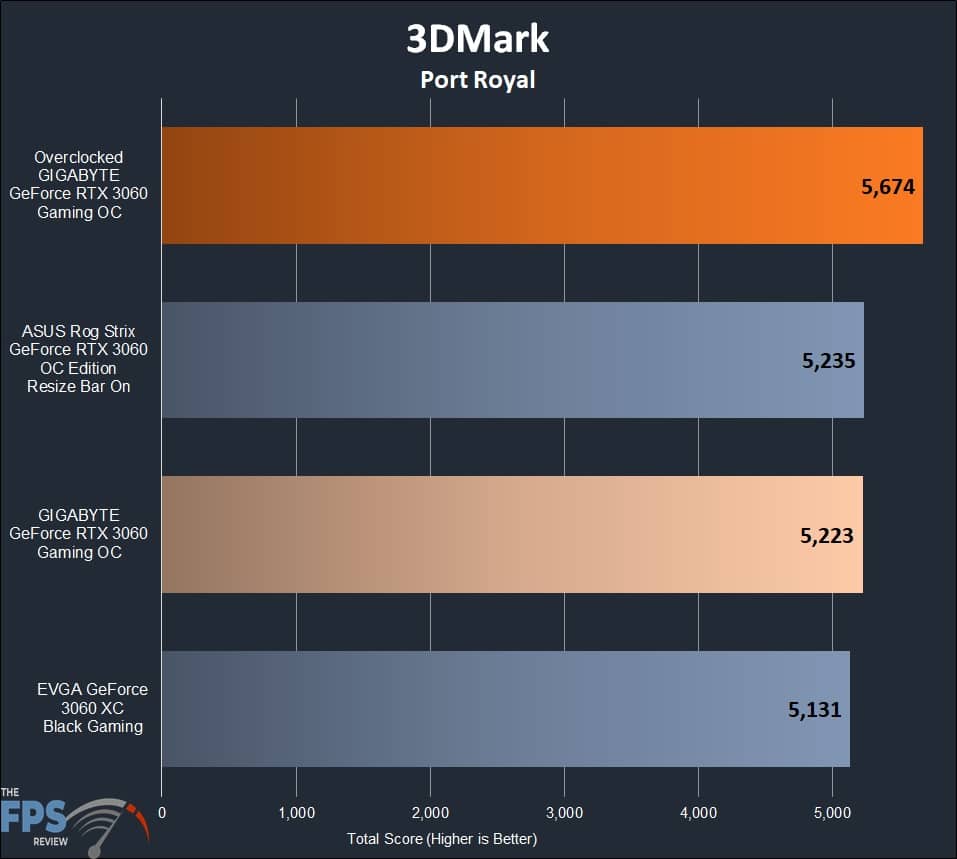
Here we see a smaller delta between our ASUS ROG Strix GeForce RTX 3060 OC Edition, and the EVGA GeForce RTX 3060 XC Black Gaming. The difference is imperceptible, with a .22% difference in favor of the ASUS model, but it’s a loss nonetheless. When comparing the GIGABYTE card and the EVGA card, we see an advantage of 1.7% for our GIGABYTE model. Turning on the overclock allows us to observe a jump in performance of 8.2% over our stock result, which is a decent jump in performance. This ends up leap-frogging the ASUS card with a score that’s 8% higher. Contrasted with the EVGA card, we see a difference in favor of our GIGABYTE card of 10% in this synthetic benchmark.
Gameplay Performance
Watch Dogs Legion
Watch Dogs Legion came out just October of last year, and with it came some impressive next-generation visuals through its heavy use of ray tracing. On top of that, this game includes a high-resolution texture option which we enable in all our testing. With everything at the max, this game can really stress current gaming systems. Let’s go ahead and see how the chart looks now that the game has been out a little while and seen some updates.
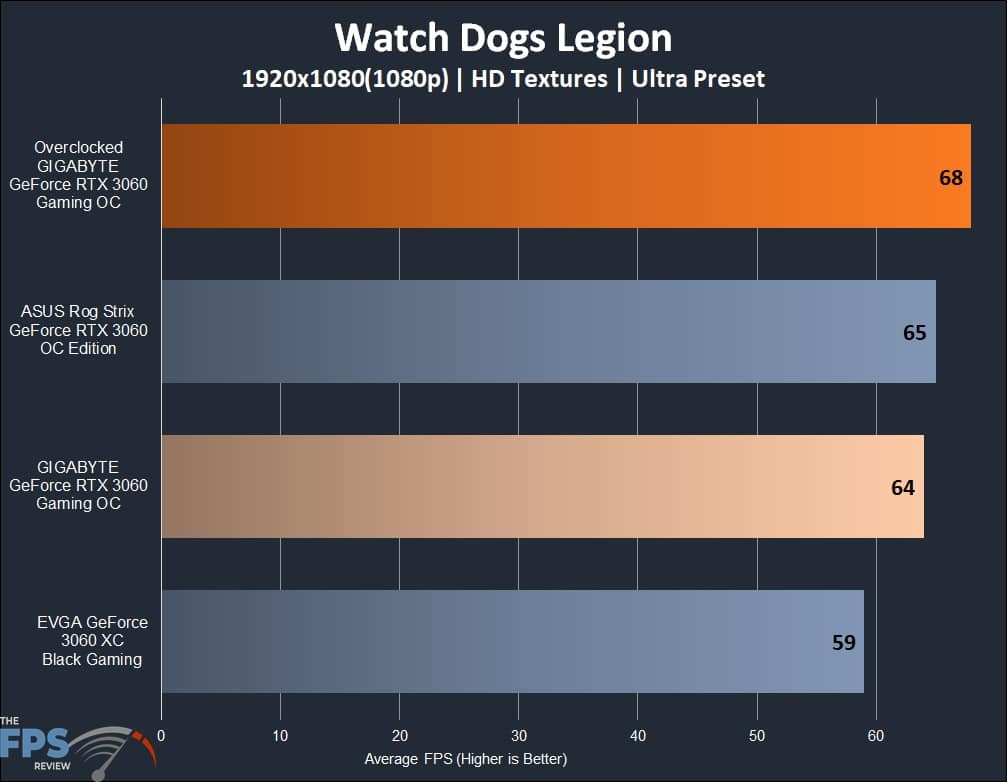
At 1080p with Ultra Settings and no Ray Tracing or DLSS, we see our review card manage 64FPS average. Our GIGABYTE GeForce RTX 3060 Gaming OC managed to sit right behind the ASUS ROG STRIX GeForce RTX 3060 OC Edition by a single frame. Both cards ended up besting the EVGA card, which managed a 59FPS average. This means that we are 8% faster using the GIGABYTE card at stock than our EVGA card, and this equates to a +5 FPS advantage in averages.
When we apply our overclock, we see a fairly decent boost in average frame rates, with our GIGABYTE card managing to reach a 68FPS average. This means we are 4.5% faster than our stock ASUS card and a big 14% increase over the stock EVGA card. This is a really respectable result from our GIGABYTE card and it’s our thought that it is consistent overclock, with its high peak clock speeds, is making this possible.
Wolfenstein Youngblood
Continuing on with our traditional game-play testing, we find ourselves loading up Wolfenstein Youngblood without DLSS or Ray Tracing enabled first.
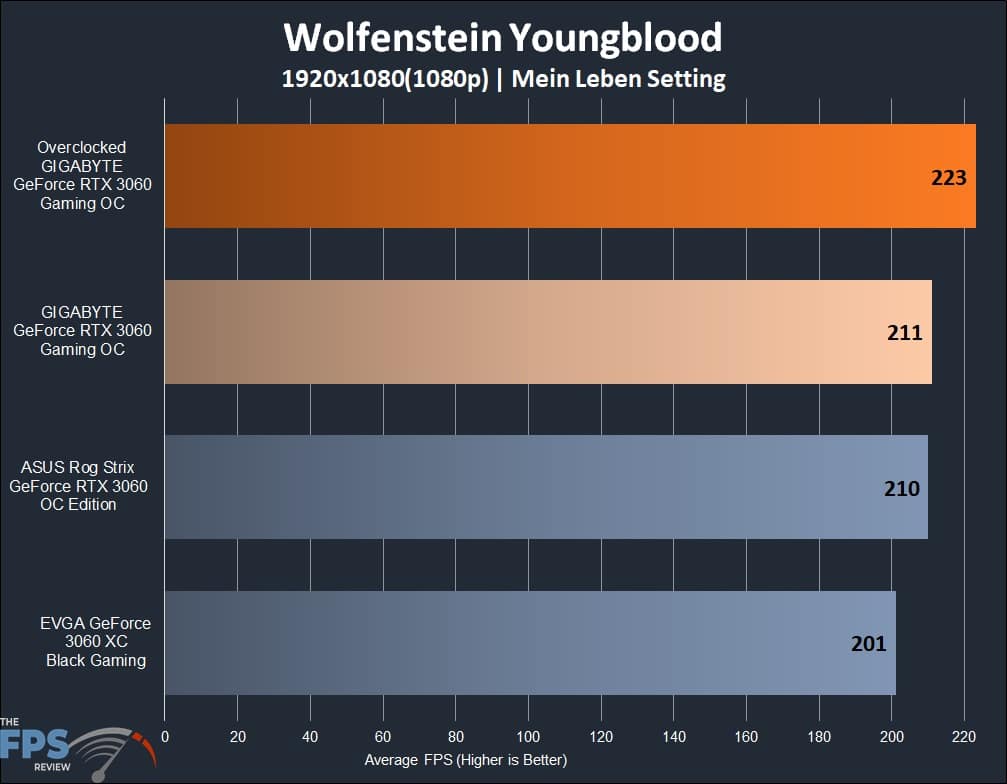
Here we see the standings again looking fairly similar, with our ASUS and GIGABYTE cards again remaining neck and neck with a 210FPS average for both. Given how closely their frequencies align, this is an understandable result. However, both cards manage to exceed the 201FPS average of the EVGA card by 4%. We then apply our overclock, which allows us to increase performance by 6% over stock, resulting in a 223FPS average. Needless to say, all these cards will result in an enjoyable gameplay experience.
Horizon Zero Dawn
Horizon Zero Dawn is an action-adventure game ported for release on PC as of August 7th, 2020. The game makes use of the DX12 API as its only option. Graphics options in this game are fairly simple, with a total of nine options for the user to adjust. We will be utilizing the game’s built-in benchmark and graphics presets, which range from Favor Performance, Original (PS4 Fidelity), Favor Quality, and Ultimate Quality.
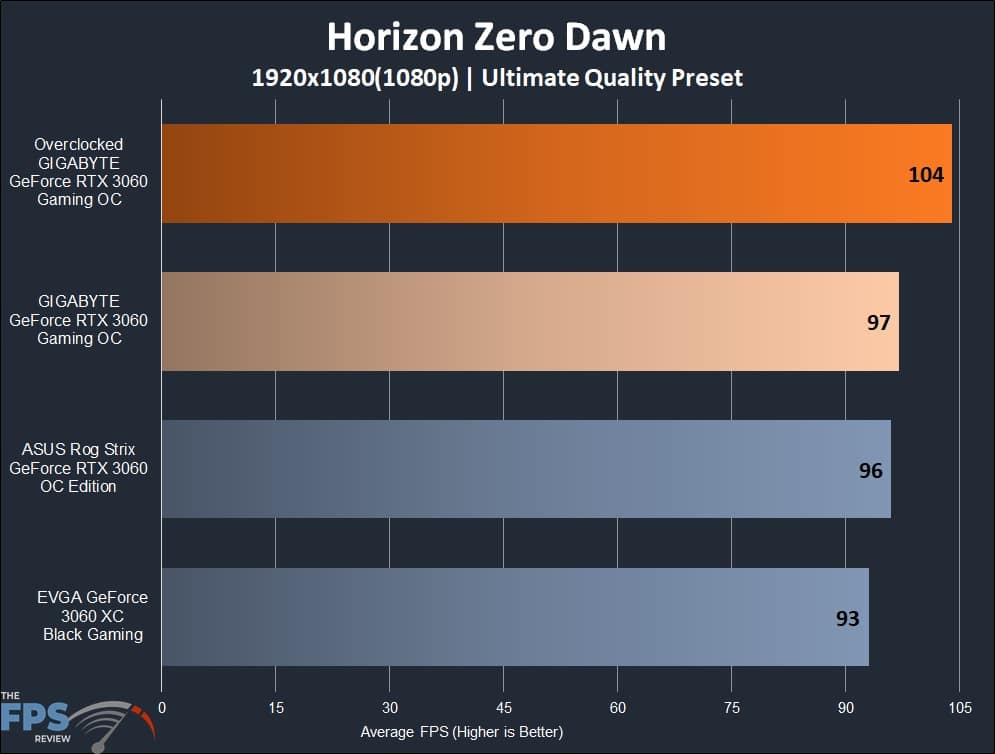
Here we see our GIGABYTE card managing to crowd the top of the chart when left at stock and overclocked. When focusing on our stock results, we see a 97FPS average for our GIGABYTE card, which is a single percentage and FPS ahead of our ASUS card that manages 96FPS. Things look better in comparison to the EVGA cards 93FPS average. In that scenario, we are 4% faster and 4FPS average above the EVGA version of this silicon. These are close results in all scenarios, all within a 5% margin of error, so let’s turn to overclocking and see what our results look like. With our OC profile applied in AORUS Engine, we see our GIGABYTE card managing 104 FPS average in this title, which is 8% faster than the stock ASUS results and 11% faster than our stock EVGA card.
F1-2020
F1-2020 is a Codemasters title and the latest release in the series of racing games. For this game, we stuck to the Italy map for our run-through, using the internal benchmark for our data.
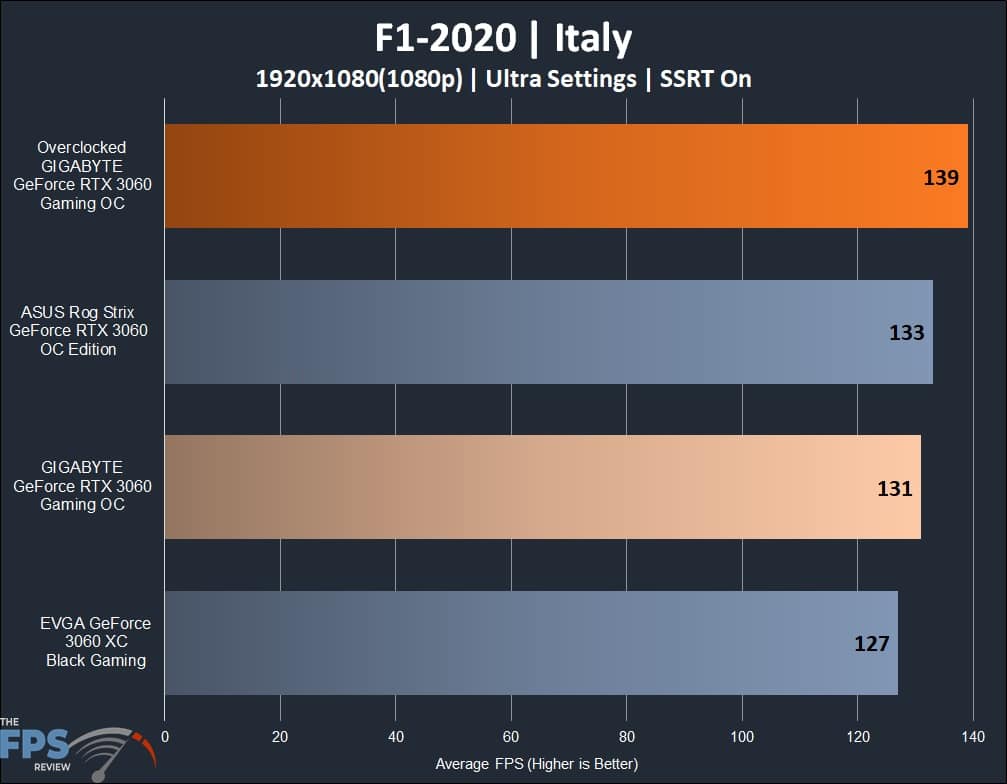
Here we see our stock GIGABYTE card falling behind our ASUS competitor by 1.5% or 2FPS average while besting our EVGA card by 3% or 4FPS average. This is one title that these video cards have no issue with at stock settings. Turning on the overclock profile we created nets us a 6% performance jump up to 139FPS average over stock. This produces a 4% performance advantage over the ASUS card and a 9% advantage over its EVGA competition. It’s interesting to note we don’t see as big a performance jump as one might expect from reducing the resolution to 1080p; we suspect this is based on some CPU limitations. Nevertheless, the gameplay experience is fine at both resolutions.
Red Dead Redemption 2
Red Dead Redemption 2 is a game that needs no introduction to our community, being the high-profile title that it is. Launched for PC on December 5th, 2019, this game is known to be demanding for almost any video card. A mixture of settings was used for this title, with all Ultra options enabled.
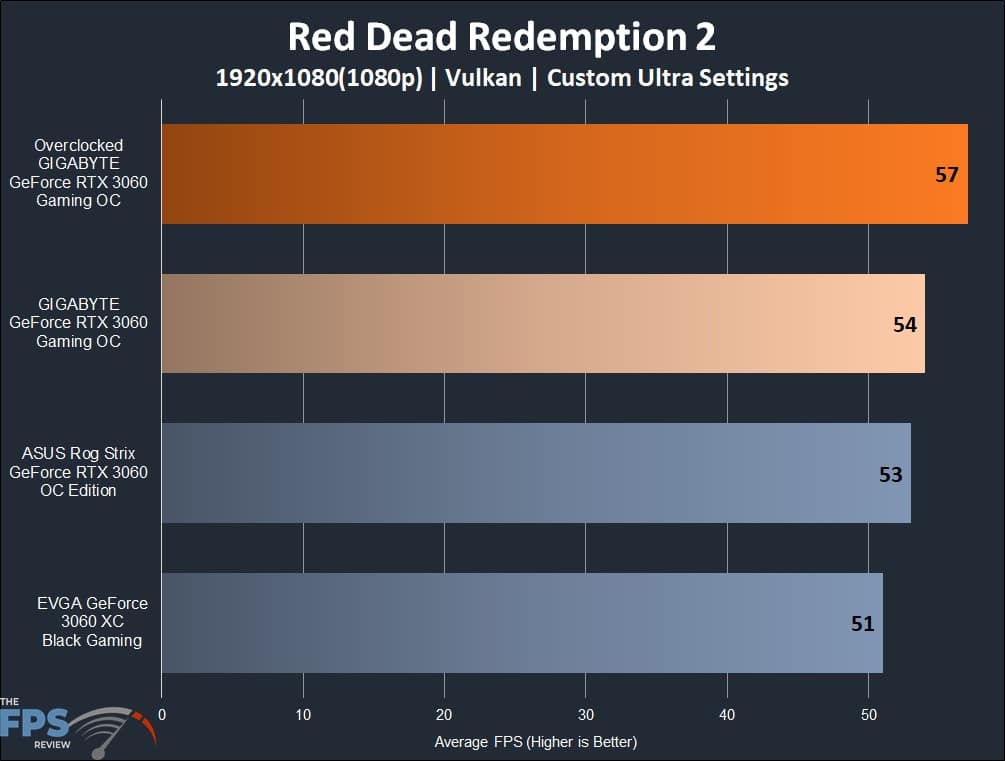
In Red Dead Redemption 2, we see our GIGABYTE card 2% ahead of our ASUS card, with the former netting 54FPS on average while the latter manages 53FPS on average. That 54FPS average ends up being 6% faster than our EVGA card which manages 51FPS on average. At stock, we see that all cards provide a playable gameplay experience with the settings turned up. Moving on to our overclocked results, we see performance jump by 5%, going from 54FPS to 57FPS averages. This is 7% ahead of our ASUS model and 11% ahead of our EVGA model.
Cyberpunk 2077
In Cyberpunk 2077, we are using patch version 1.3 of the game, the Ultra “Quick Preset” without modifications. We are utilizing a custom driving course at night and averaging our results after multiple runs.
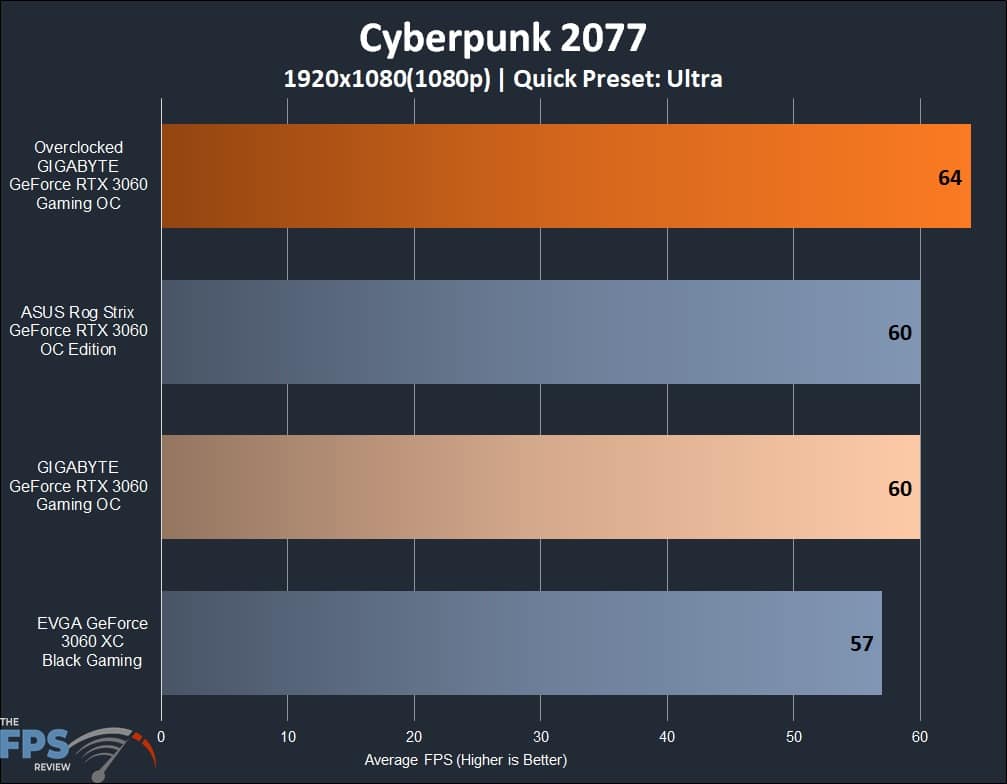
Here we again see our review card and the ASUS competition remaining at a standstill, both averaging 60FPS. This means both these cards are 5% faster than the EVGA competition when playing this title. Overclocking helps push average frame rates up to 64FPS, which means we are now 6% faster than our ASUS card and 11% faster than our EVGA card.
Dirt 5
In Dirt 5, we are using the new patch update 5.01. We set all the graphics options to the highest values. We manually select the resolution and do not let the game manage automatic resolution scaling; we hard-set the resolution in all three categories to the resolution being tested. We use the built-in benchmark.
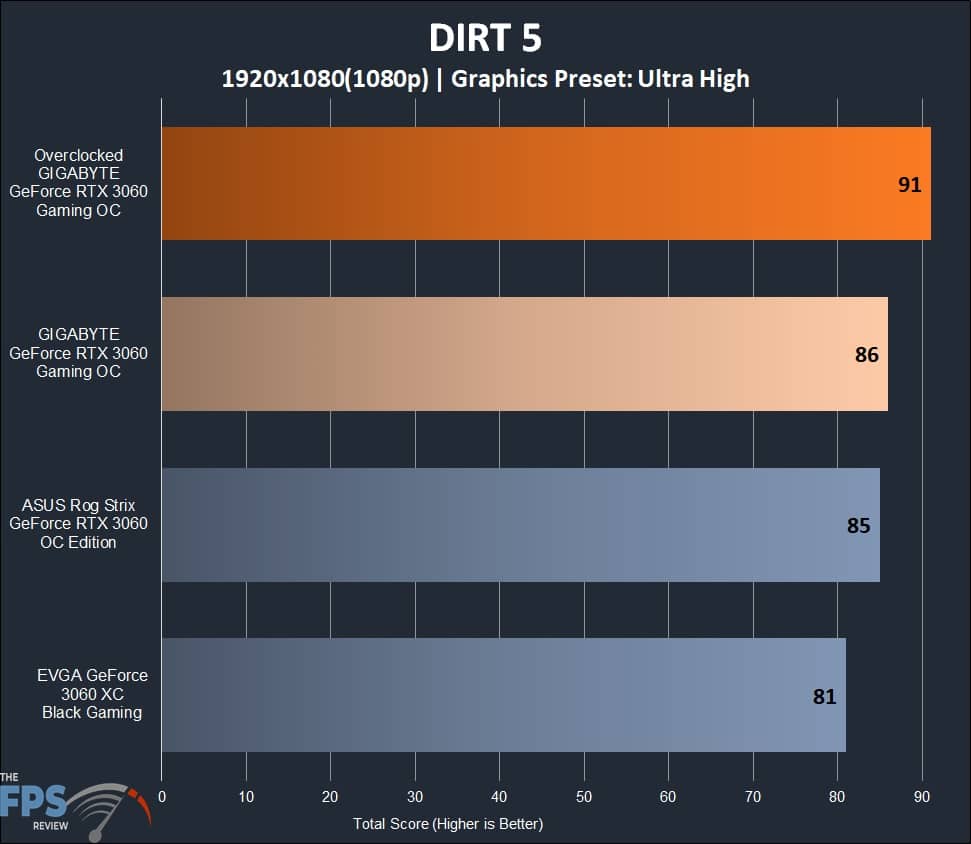
In Dirt 5, we have our GIGABYTE card in a dead heat with our ASUS card, both outputting 86FPS averages. They both end up 6% faster than the reference specification EVGA card that was able to give us 81FPS average during our testing. Overclocking nets us 6% more performance and a healthy 91FPS average. Needless to say, that’s 6% faster than the ASUS card, but more importantly, it’s 12% faster than our EVGA card.
Ray Tracing and DLSS Gaming Performance
Watch Dogs Legion
In Watch Dogs Legion, we use the graphics preset to select “Ultra” quality. We manually enable “Ultra” Ray Tracing when testing that, plus “Quality” DLSS when testing DLSS with Ray Tracing. We use the built-in benchmark for testing.
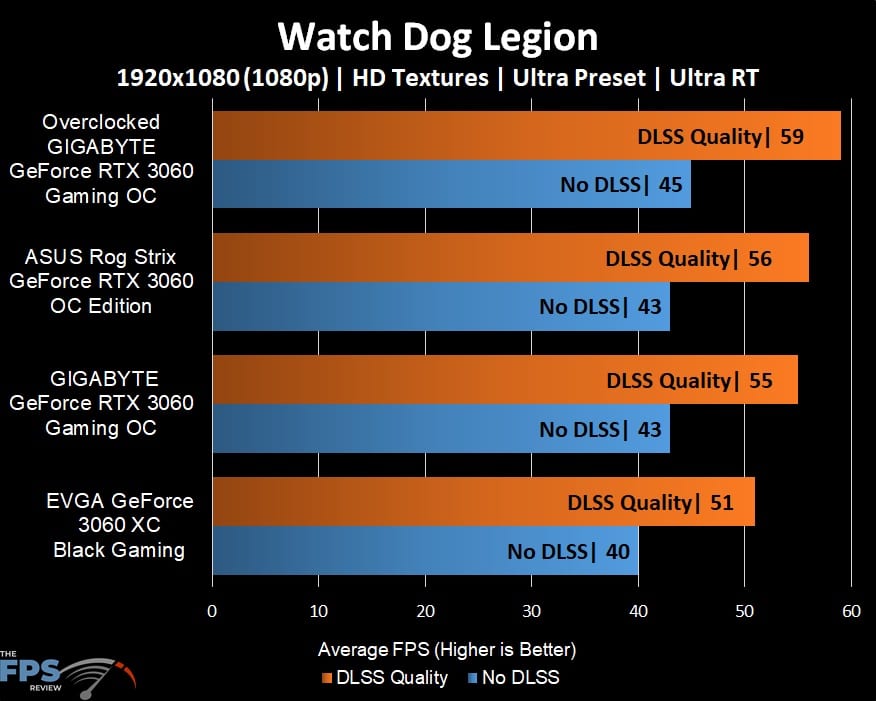
Results here are very similar to our CyberPunk 2077 results, with our review card and our ASUS card ending up tied with 43FPS averages. That makes both cards 7% faster than the EVGA GeForce RTX 3060 XC Black Gaming, which produced 40FPS on average in our testing. Of course, we turn to GIGABYTE’s AORUS Engine software to apply our overclocked profile and see how big a jump we can manage. With our settings applied, our GIGABYTE card jumps up by a mere 2 FPS, getting us 45 FPS on average. This is 4% faster when compared with both our stock result and the ASUS cards result, as well as 11% faster than our EVGA card. These are playable, but not ideal, frame rates, so we switch on DLSS to see how much performance we can gain.
With DLSS we see our average frame rate jump to 55FPS, compared to 43 when left at stock settings. This gives our GIGABYTE card a large 24% increase in performance just by enabling DLSS. Continuing with their theme of trading blows in every other title, we see our ASUS card slightly edge out our GIGABYTE card when DLSS is applied. These 1% and 1FPS differences are imperceptible in gameplay, but it was reproducible in testing. Our EVGA card remained 7% behind our GIGABYTE card, with an average of 51FPS with DLSS applied.
Wolfenstein Youngblood
In Wolfenstein Youngblood, the game runs in the Vulkan API. We set the graphics option to “Mein Leben!” for the highest settings. We enable Ray Tracing and DLSS on Quality Mode as needed. When not using DLSS, the NVIDIA Adaptive Shading option is on Quality. We leave the rest of the settings at default. We use the built-in benchmark of Riverside for testing.
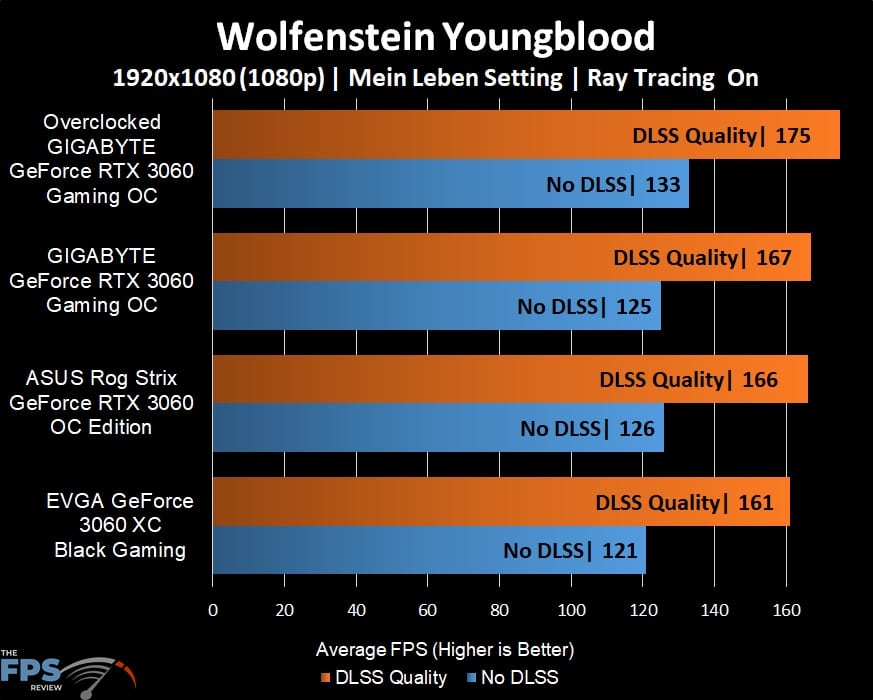
In Wolfenstein Youngblood, we see healthy results from each video card in our review. Without DLSS or overclocks applied, we are seeing a 121FPS average from our EVGA card, a 125FPS average from our GIGABYTE card, and 126FPS from our ASUS card. This equates to our GIGABYTE card being .7% slower than our ASUS card and 3% faster than our EVGA card. Applying an overclock pushes the GIGABYTE GeForce RTXS 3060 Gaming OC to 133 FPS average, which is 6% faster than in stock operation. That is 5% faster than the ASUS card and 9% faster than the EVGA card.
Turning on DLSS, we see how much performance can be gained when utilizing this feature. We were left impressed, as usual, after seeing as much as a 28% increase in performance. This is exactly the case with our stock results, jumping up from 125FPS to 167FPS on average once DLSS was enabled. This is 0.6% faster than the ASUS card at 166FPS and 3% faster than our EVGA cards 161FPS.
Red Dead Redemption 2
Red Dead Redemption 2 issued a patch somewhat recently this year that enables DLSS in this title. Red Dead is a fairly intensive game, so this patch addition was received with a warm welcome by many. Let’s see how performance is affected when utilizing DLSS in this title.
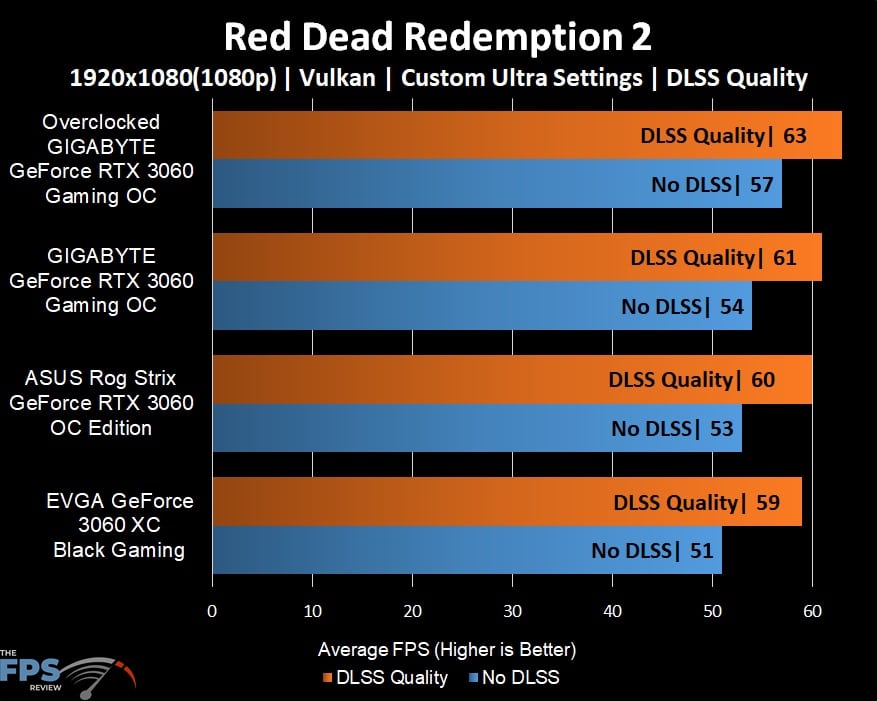
When left without DLSS, we see all of our cards managing 50+ FPS averages, all cards are producing playable frame rate averages in this single-player title. Our GIGABYTE card gets 54FPS on average, which increases to 61FPS with DLSS turned on. This is a 12% performance increase when left with stock settings. That is a 2% advantage over our ASUS cards result with DLSS enabled, where it managed to churn out a 60 FPS average. This ends up also being a 3% performance advantage over our EVGA card with its 59 FPS average. Overclocking gets a small boost with DLSS enabled, going from a 57 FPS average to a 63 FPS average. That’s 5% faster than our ASUS card and 7% faster than our EVGA card. The performance benefits we experienced with the DLSS feature addition is a really appreciated update to see this long after release.
Cyberpunk2077
For Cyberpunk 2077 we are using patched version 1.3 for testing. We use the in-game graphics presets for testing at “Ultra” settings and enable Ray Tracing at Ultra as well. We test without DLSS first and then enable DLSS. We then do a manual run-through in the game for the benchmark data.
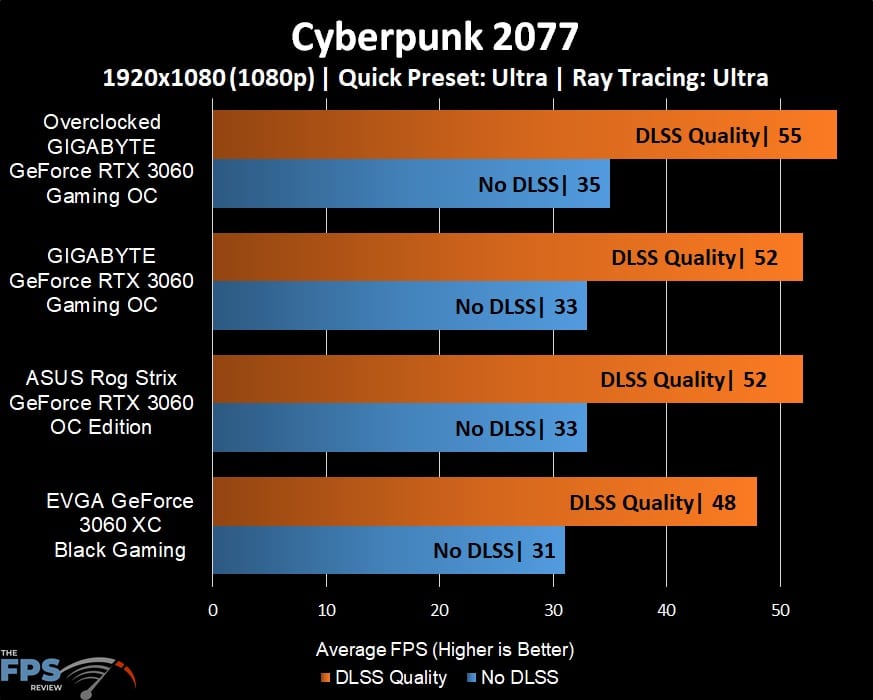
Here we see our cards barely maintaining +30 FPS averages across the board with these settings at 1080p; Ray Tracing is clearly putting these cards through their paces. Our stock GIGABYTE card ties the ASUS card’s 33 FPS average. Our GIGABYTE card managed to stay 6% faster than our EVGA card, which ended up outputting 31FPS on average. Next, we turn to overclocking while keeping DLSS off. This pushes the GIGABYTE card up by 6% in performance over both itself and the ASUS card, with an average FPS of 35 vs 33. The lead over our EVGA card grew to 12% with the overclock applied.
It’s apparent with this title that we have a prime candidate for DLSS, so we can retain Ray Tracing and get enjoyable frame rates. With DLSS enabled we see a big uptick, with our stock result gaining 19 FPS in average frame rates. That’s a big 44% performance increase and ties the performance increase we experienced with our ASUS card. Our EVGA card falls behind the competition by 8% with an average of 48 FPS with DLSS enabled. With DLSS and our overclock applied we see a performance increase of 5%, from 52 to 55 FPS. This also ends up being a 5% advantage over the ASUS card whereas it is 13% faster than the EVGA card.
Dirt 5
We are revisiting Dirt 5, but this time with Ray Tracing enabled to see how much performance is ultimately affected. The implementation of Ray Tracing in Dirt 5 is fairly tame in comparison to some other titles on this list, so we expect to see very playable framerates.
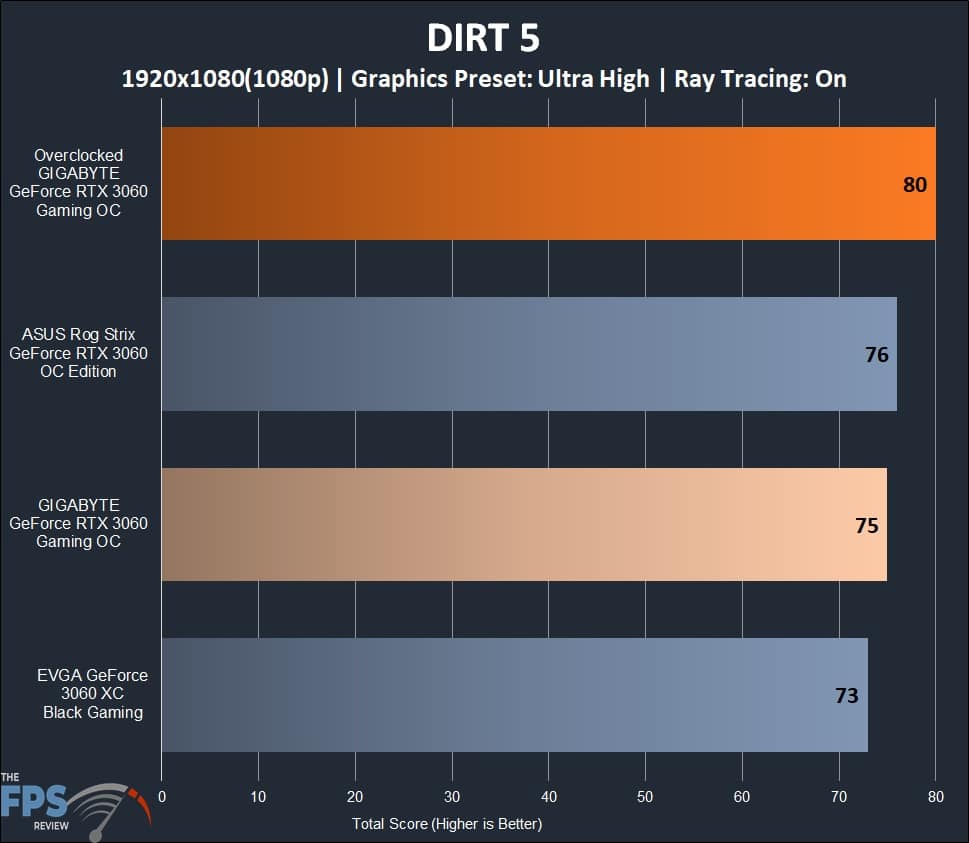
A fairly familiar situation plays out here in the Dirt 5 results, with our GIGABYTE card besting the EVGA card and falling just behind the ASUS card again. It’s a close spread between all the cards here, with the GIGABYTE card managing 75FPS, the ASUS card managing 76FPS, and our EVGA card pushing 73FPS on average. That’s a 3% advantage for our GIGABYTE card when compared against the EVGA variant and a 1.3% disadvantage when compared with the ASUS variant. Overclocking gives the GIGABYTE card a decent lead of 5% over the ASUS card and 9% over our EVGA card.
Metro Exodus Enhanced
On May 6th, 2021, developer 4A Games released Metro Exodus Enhanced Edition, an update that requires users to have a Ray Tracing-compatible video card as a minimum requirement. In this updated title, we see 4K resolution textures, Variable Rate Shading, Fully Ray Traced Light Sources, Ray Traced emissive surfaces, Ray Traced area shadows, Ray Traced reflections, and much more. For our performance testing, we will be utilizing the provided benchmark tool included with the game.
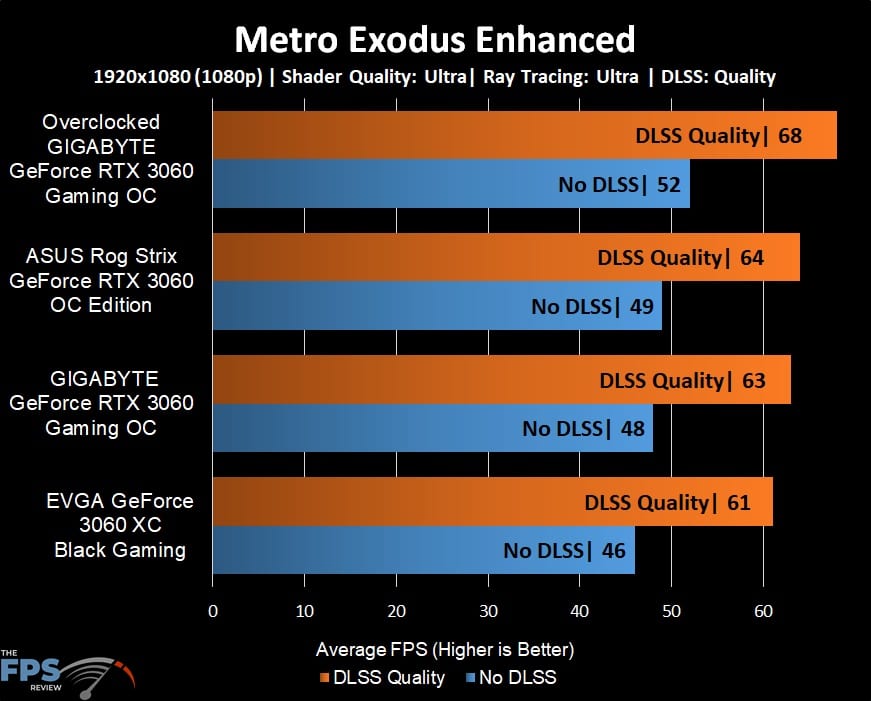
At 1080p with shader quality set to Ultra, Ray Tracing set to Ultra, and no DLSS, we see our cards performing fairly well given how heavily this game utilizes Ray Tracing. The GIGABYTE card ends up with a 48 FPS average with is 2% behind our ASUS card, which put out 49FPS. Our EVGA card’s 46 FPS average is outperformed by 4% when compared to our GIGABYTE card at 48FPS average. Overclocking bumps us up into a slightly more enjoyable gameplay experience with averages reaching 52FPS, or 8% higher compared to stock. This is 6% faster than the ASUS ROG STRIX card and 12% faster than our EVGA XC Black Gaming.
In order to achieve a solid 60FPS average across the board, we had to rely on DLSS set to Quality when testing this title. The performance boost is clear as day, with our GIGABYTE card gaining 27% more performance as it goes from 48 FPS to 63 FPS averages. The standings here didn’t budge, with our ASUS card still producing a single extra average frame, giving it the slightest edge with 64 FPS. That works out to a 1.5% difference between these two cards. Here we again see our EVGA card falling behind, with averages that are 3% behind our GIGABYTE card and 5% behind our ASUS card. Overclocking increased performance here by 8% over stock. Our ASUS card was outperformed by 6% while our EVGA card got left behind with an 11% performance gap here.
Power and Temperature Testing
To test the power and temperature, we performed a manual run-through in Cyberpunk 2077 at “Ultra” settings for real-world, in-game data. We used GPUz sensor data to record the results. We report on the GPUz sensor data for “Board Power” and “GPU Chip Power” when available for our Wattage data. During testing, the measured ambient room temperature was 72 F/22.2 C.
Power
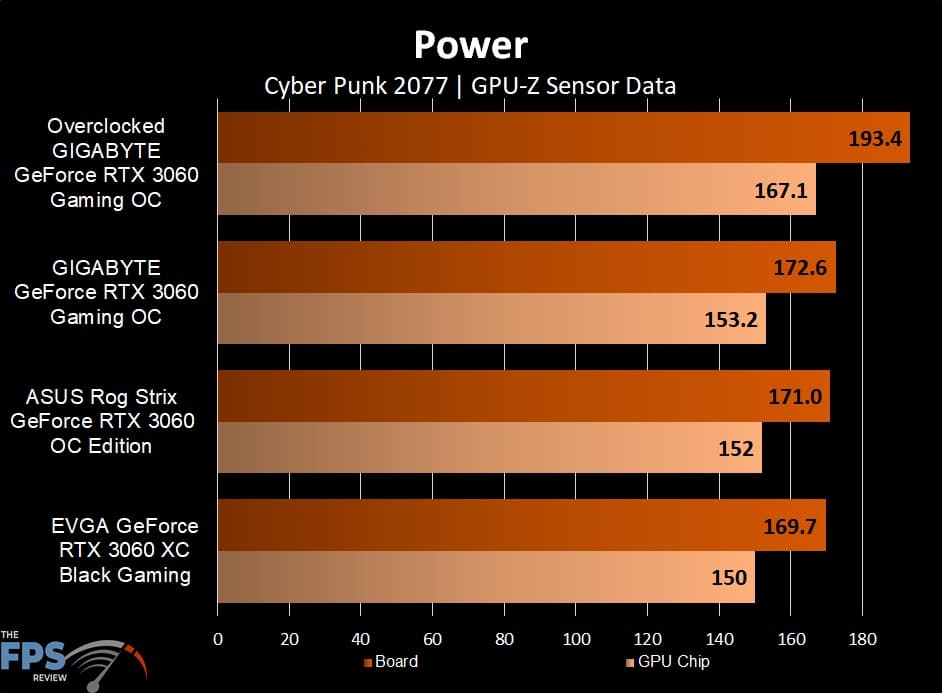
In this graph, we see all of our cards consuming similar amounts of energy, which is not surprising given they are all share the same silicon under the hood. The GIGABYTE card manages to consume the most power at stock, but it’s all within the margin of error here. Looking at our GPU Chip results, we see the GIGABYTE card pulling 153.2 Watts at maximum. That is a mere 0.7% more power than our ASUS card and 2% more power than our EVGA card. Flipping on our overclock pushes GPU Chip power consumption up by 6% at 167.1 Watts. That’s 9% more power than the ASUS card and 11% more power than our EVGA card.
Our standings remain unchanged when taking a look at total board power. We see a maximum reported board power of 172.6 Watts for our GIGABYTE card, which is a mere 1% more power than our ASUS card and 2% more power than our EVGA card. Overclocking increases our power demand by 11%, reaching maximums of 193.4 Watts. That’s 12% more power than the ASUS card and 13% more power than our EVGA card.
Temperature
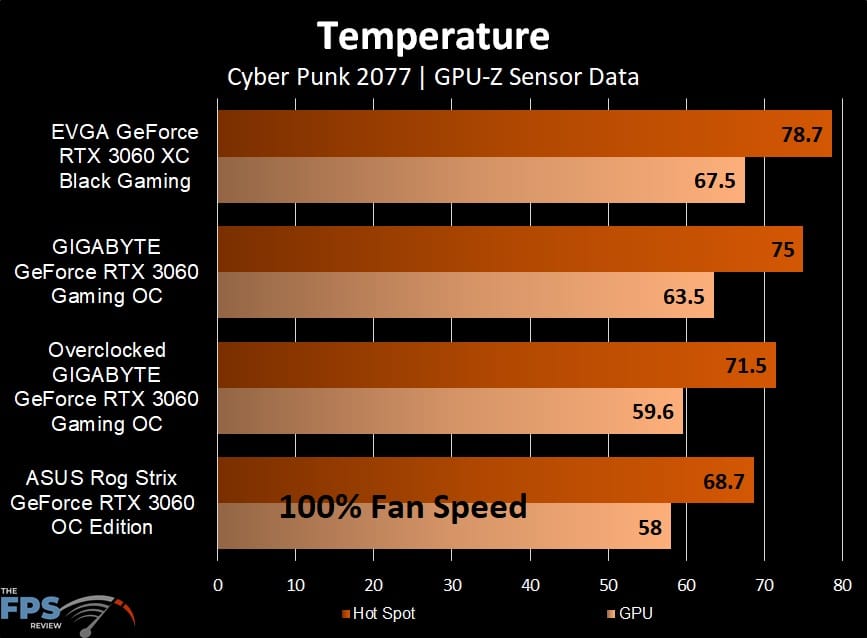
We saw a fairly wide difference when it came to temperatures, which makes sense given each card has its own unique thermal solution which each produces a different result. Starting off, let us focus on the maximum reported GPU temperatures before moving on to Hot Spot temperatures. Our GIGABYTE card ends up running hotter than our ASUS card to the tune of 9%. Left at stock, we see our GIGABYTE card getting to 63.5C, which is a good showing, but not as impressive as the ASUS card’s 58C. Our EVGA card with its smaller cooler ends up running hotter, with a temperature of 67.5C, which ends up being 6% hotter than our stock GIGABYTE results.
When looking at GPU Hot Spot temperatures, we see the GIGABYTE card reporting maximums of 75C, which is a good showing, but still 9% hotter than our ASUS card at 68.7C. EVGA comes in dead last, with its GPU Hot Spot Temperatures reaching 78.7C; that’s about 5% hotter than our review card today.
With the overclock profile turned on, our fan speeds ramp up to their maximum, which ends up dropping temperatures substantially even with higher clock speeds. Now we are seeing a 59.6C maximum for GPU temperatures and 71.5C GPU Hot Spot temperatures. This is 6% cooler than the stock GIGABYTE cards GPU temperatures and 5% cooler than our stock GPU Hot Spot temperatures. Additionally, we manage to get results that are 2% hotter than the stock ASUS card and 12% cooler than our EVGA card in regards to GPU temperatures. A lesser difference was noted when looking at our GPU Hot Spot temperatures, where we were 4% hotter than our ASUS card and 9% cooler than the EVGA card.
Ultimately our testing proves that GIGABYTE has a capable cooler on their hands, albeit not as efficient as the ASUS cards thermal solution. At stock, we observed temperatures that were slightly hotter than our ASUS competition. ASUS deserves some credit here with just how well they designed their thermal solution. With our fan speeds set to 100%, we managed to remove more heat, but the noise was simply untenable for 24/7 home use. Thankfully, we can report absolutely zero coil whine with this video card. It’s worth noting that with a bit of time and patience, you could likely set up a fan curve profile that retains the majority of your clock speed increases from overclocking.
