Update (8/15/2023): Thanks to one of our readers who clicked on the link in the original report for one of the drives said to be used in the test we’ve become aware that this test may not actually be as it was titled in said report. According to Micron’s spec sheets, the drive used is actually a TLC drive. We have reached out to Scalability regarding confirmation of which drive was in fact used and will update upon notification.
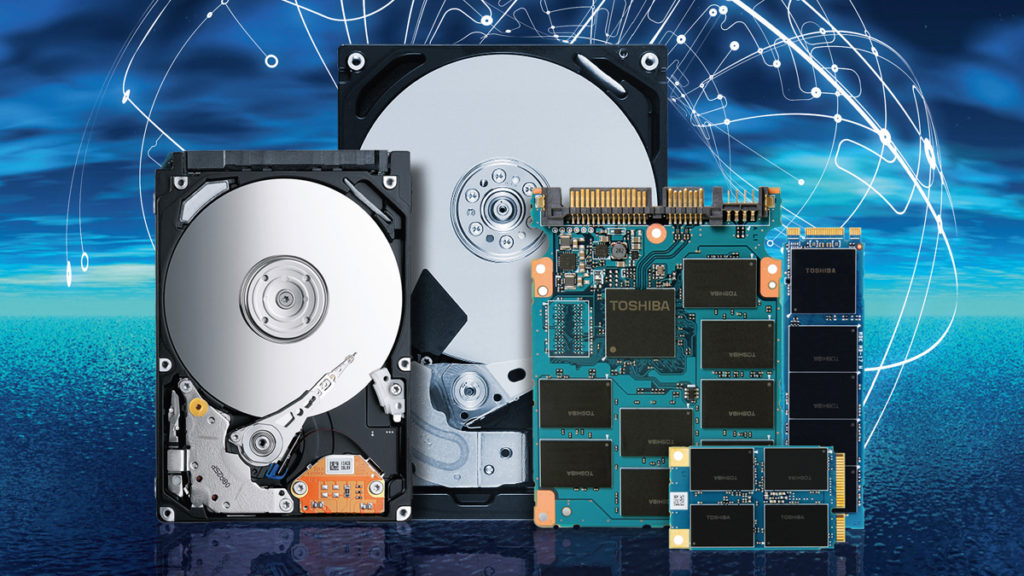
A new report shows that the belief that SSDs are more power efficient than good old-fashioned platter drives may not be completely accurate. Solid-state drives began taking over as the go-to storage medium for consumers, and select hi-density enterprise solutions roughly a decade ago. Prices continue to drop as new technologies are introduced and older ones are more widely produced, and this is still true for both mediums. Now while the new report examines a very specific set of metrics it does expose a commonly misunderstood belief about the newer flash-based drives. The new report shows that specifically, hi-density QLC SDDs can use a significantly greater amount of power during read/write tasks.
QLC SSD vs. HDD
| Power Data Per Drive | SSD | HDD | HDD Advantage |
|---|---|---|---|
| Idle (watts) | 5 | 5.7 | -14% |
| Active read (watts) | 15 | 9.4 | 37% |
| Active write (watts) | 20 | 6.4 | 68% |
| Read-intensive workload (avg. watts) | 14.5 | 8.7 | 40% |
| Write-intensive workload (avg. watts) | 18 | 6.6 | 63% |
| Power-density read-intensive (TB/watt) | 2.1 | 2.5 | 19% |
| Power-density write-intensive (TB/watt) | 1.7 | 3.3 | 94% |
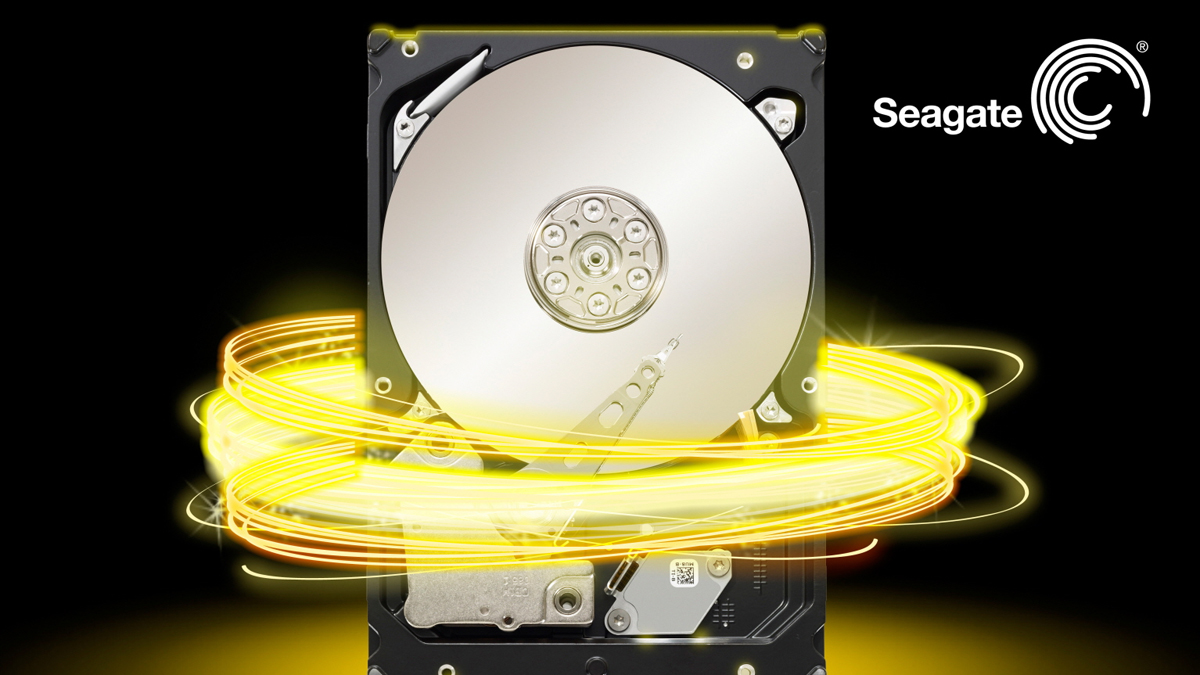
The above data was provided by Scality (via Tom’s Hardware) who was examining the power efficiency of hi-density drives which are more commonly found in enterprise or data center servers. Now as most consumers are unlikely to have such drives in their homes, except for the occasional enthusiast with a larger NAS or media server, the data may not be directly relatable but it’s still worth noting for those trying to keep their power usage to a minimum. Scality used a Micron 6500 ION 30.72 TB QLC SSD and a Seagate Exos X22 7200 RPM 22 TB HDD. These obviously are not like-for-like comparisons and as the SSD has a significantly larger storage capacity so it should be expected to consume more power than a similarly sized drive, but even then the numbers are a bit more extreme.
And the winner is. . .
Now the Seagate HDD clearly comes out on top as being more power efficient as it only loses out during idle operation but at that point, it’s only by 0.7 Watts, 5.7 W vs 5 W. Meanwhile, the Micron QLC SSD displays a bit more of an appetite for power when in use. Testing showed that the Seagate HDD could be anywhere from 19% to 94% more efficient in its power consumption than the QLC SSD. It was explained that two types of workloads were looked at, one more focused on read-intensive tasks and the other on write-intensive tasks: 10% idle/80% read/10% write and then 10% idle/10% read/80% write. The calculation methodology used for the data (which was rounded to the nearest tenth) in the above table was as follows.
Per Scalability
“Micron ION:
- Power consumption (read-intensive): (5*0.10 + 15*0.8 + 20*0.10) watts = 14.5 watts
- Power density (read-intensive): 30.72 TB / 14.5 watts = 2.1 TB / watt
- Power consumption (write-intensive): (5*0.10 + 15*0.10 + 20*0.80) watts = 18 watts
- Power density (write-intensive): 30.72 TB / 18 watts = 1.7 TB / watt
Seagate EXOS:
- Power consumption (read-intensive): (5.7*0.10 + 9.4*0.80 + 6.4*0.10) watts = 8.7 watts
- Power density (read-intensive): 22 TB / 8.7 watts = 2.5 TB / watt
- Power consumption (write-intensive): (5.7*0.10 + 9.4*0.10 + 6.4*0.80) watts = 6.6 watts
- Power density (write-intensive): 22 TB / 6.6 watts = 3.3 TB / watt”
The researchers do state that power consumption should not be the main metric for making a purchasing decision. In fact, there are many other details to be looked at and from consumers to prosumers the type of workload and each user’s unique needs ultimately should be the deciding factors but this report does provide a measure of myth-busting.