Synthetic System Benchmarks
On this page, we will show synthetic benchmarks, some that test a variety of system use-case scenarios, and others that test specific multi-core and single-core/thread workloads to hone in on performance differences. Note that the graphs are arranged from fastest to slowest. The Intel Core Ultra 9 285K and 245K are highlighted in blue for the Windows 11 Power Mode: “Best Performance” and they are highlighted in orange for the Windows 11 Power Mode: “Balanced.” All CPUs on the graph are tested in Windows 11 Power Mode: “Balanced” for comparison. In the graphs “Win11: PM” stands for Windows 11 Power Mode.
PCMark 10 Express
PCMark 10 Express tests workloads as follows: PCMark 10 Express is a benchmark that focuses on basic work tasks. It is a good choice when tendering for PCs for general office use. The PCMark 10 Express benchmark focuses on the performance needs of a typical office worker. It tests Essentials and Productivity.
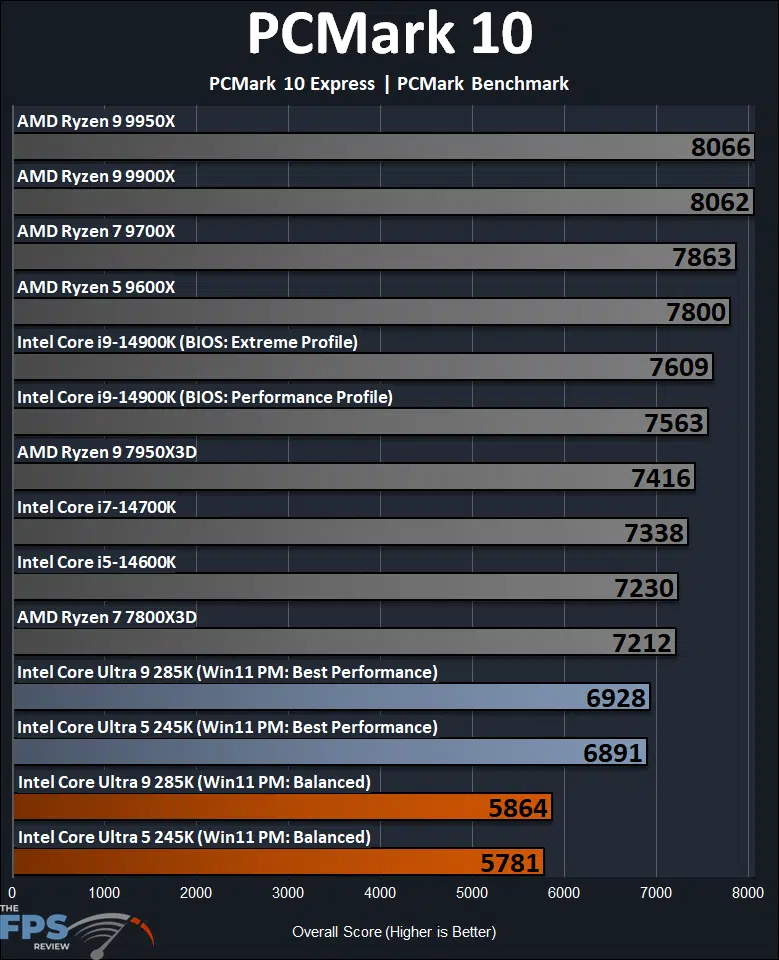
PCMark 10 Express highlights the single-core/single-thread performance of CPUs. From this, the first thing to notice is that there is a pretty major difference in performance between the Intel Core Ultra 9 285K and Intel Core Ultra 5 245K between the “Balanced” Windows 11 Power Mode profile, and “Best Performance.” This extreme difference is not experienced on the other CPUs, which performed as expected on the Windows 11 defaults of “Balanced” Power Mode. It is such that the Intel Core Ultra 9 285K is 15% slower on “Balanced” compared to “Best Performance”, and the Ultra 5 245K is 16% slower.
If we straight up compare ‘equal’ Power Mode settings at “Balanced”, the Intel Core Ultra 9 285K is 23% slower than the last generation Intel Core i9-14900K on the default “Extreme Profile” in BIOS. In the Performance Profile in BIOS, it is 23% slower. The Intel Core Ultra 9 285K ends up being 27% slower than the AMD Ryzen 9 9950X.
If we, however, compare the Intel Core Ultra 9 285K using “Best Performance” Win11 Power Mode profile, then the 258K is 9% slower than the Intel Core i9-14900K in the Extreme profile, and 8% slower in the Performance profile. Overall, even at the 285K’s best, it is still slower than the 14900K, even in the more capped Performance Profile. Compared to the Ryzen 9 9950X, the 285K is 14% slower, at its best.
Looking at the Intel Core 5 245K, we find that in the Windows 11 Power Mode of Balanced profile, the 245K is 20% slower than the Intel Core i5-14600K from the last generation. In the Windows 11 Power Mode of Best Performance, the 245K is 5% slower than the Intel Core i5-14600K. Compared to the AMD Ryzen 7 9700X the 245K is 26% slower in Balanced profile mode, and 12% slower than the 9700X with the 245K in Best Performance power profile mode. Therefore, even at the 245K’s best, it is still slower than the competition’s 9700X.
Geekbench 6
We are using Geekbench version 6.3.0 for our testing. We will show Multi-Core (nT) and Single-Core (1T) performance in separate graphs.
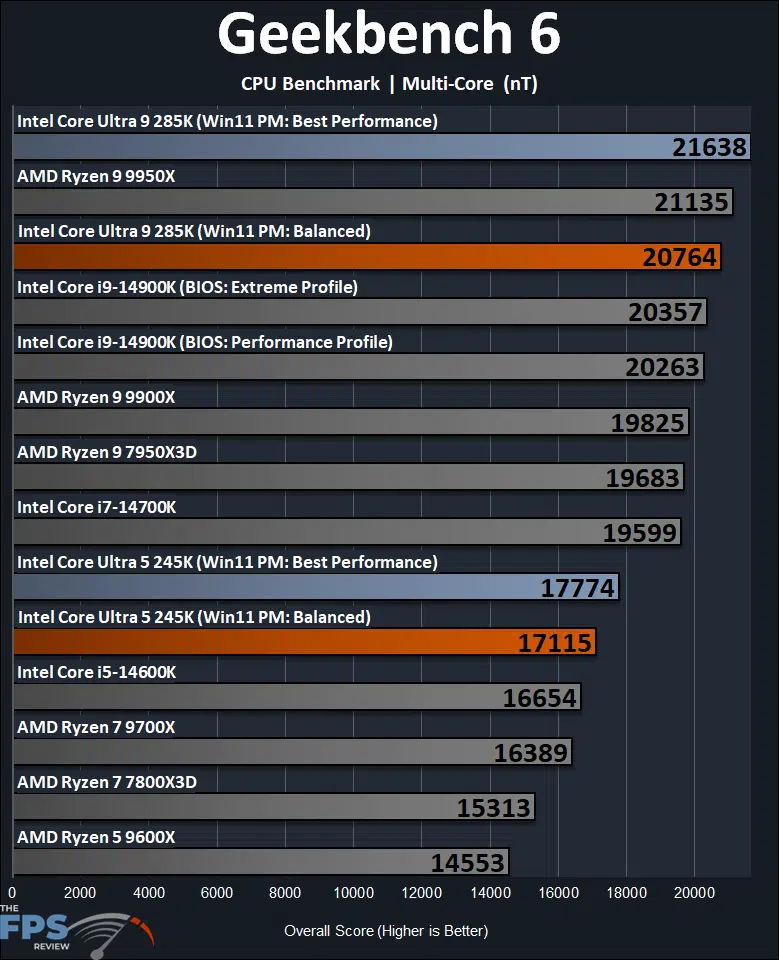
In Geekbench 6, we are looking at multi-core performance above. We do see a difference between the Windows 11 Power Mode profiles, but it is less pronounced in multi-core performance than it was in single-core performance. Again, all the other CPUs for comparison are in “Balanced” mode above. The Intel Core Ultra 9 285K is 4% slower in Balanced mode, and the 245K is also 4% slower in Balanced mode.
Comparing CPUs, the Intel Core Ultra 9 285K ends up being just 2% faster than the Intel Core i9-14900K, when the 285K is in Balanced mode. However, in the Best Performance mode, the 285K ends up being 6% faster than the Intel Core i9-14900K. Compared to the competition, the 285K is 2% slower than the Ryzen 9 9950X when the 285K is in Balanced mode, but that switches in Best Performance mode, where the 285K ends up being 2% faster than the 9950X, when the 285K is in Best Performance mode, still overall, very close performance either way.
The Intel Core Ultra 5 245K ends up being slightly faster than the Intel Core i5-14600K in either performance profile mode of Windows 11. It’s about 3% faster in Balanced mode, and 7% faster in Best Performance power mode. The 245K also appears to be faster than the Ryzen 9 9700X. In Balanced power profile, it is 4% faster than the 9700X, and in Best Performance power profile it is 8% faster than the 9700X.
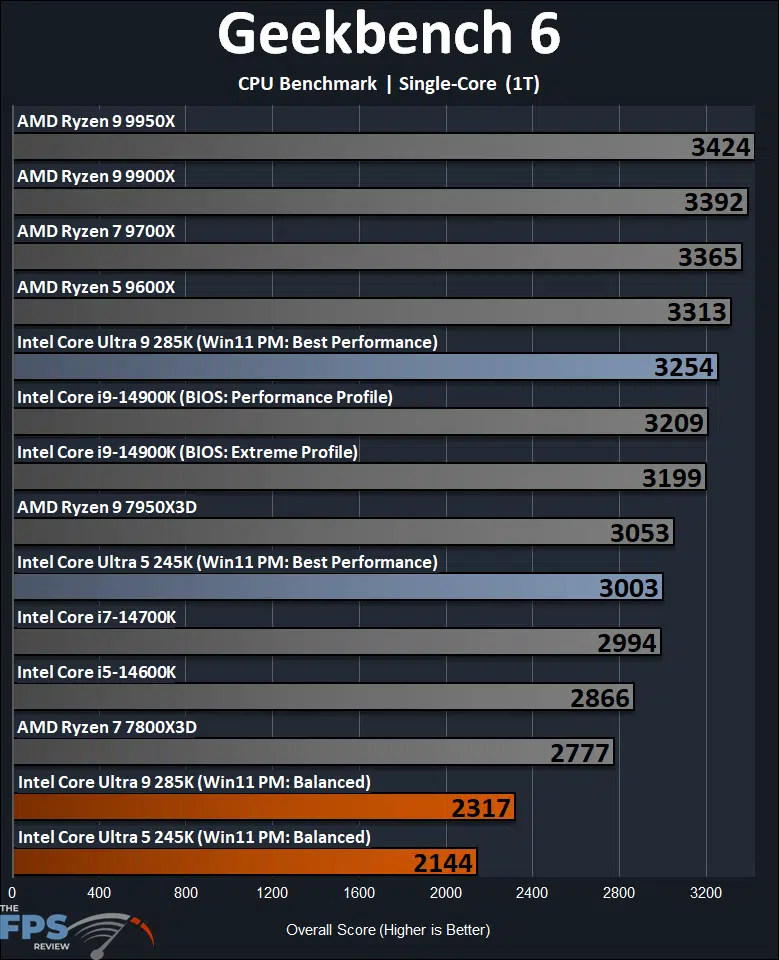
The graph above illustrates how devastating the “Balanced” power profile is on the new Arrow Lake CPUs in single-core (1T) CPU performance. Here, we find the Intel Core 9 285K is 29% slower in Balanced profile compared to Best Performance, and the 245K is also 29% slower. A reminder that the comparison CPUs on this graph are all in “Balanced” power profile, and did not experience this odd shifting.
If we keep like-for-like, and compare at the “Balanced” power profile, then the Intel Core Ultra 9 285K is 28% slower than the last generation Intel Core i9-14900K, and 32% slower than the Ryzen 9 9950X. However, if we compare the 285K at the “Best Performance” power profile, then the 285K is a small 1.4% faster than the Intel Core i9-14900K in 1T CPU performance, a very minor difference, in the best case scenario. This still makes the Intel Core Ultra 9 285K 5% slower than the Ryzen 9 9950X.
Looking at the Intel Core Ultra 5 245K in a like-for-like “Balanced” power profile, then the 245K is 25% slower than the Intel Core i5-14600K, and 36% slower than the Ryzen 7 9700X. When we set the 245K to the “Best Performance” power profile the 245K is now faster than the 14600K by 5%. However, it is still slower than the Ryzen 9 9700X by 11%.
3DMark CPU Profile
We are testing 3DMark’s CPU Profile which tests Max Thread performance and Single Thread performance, we are reporting both on separate graphs.
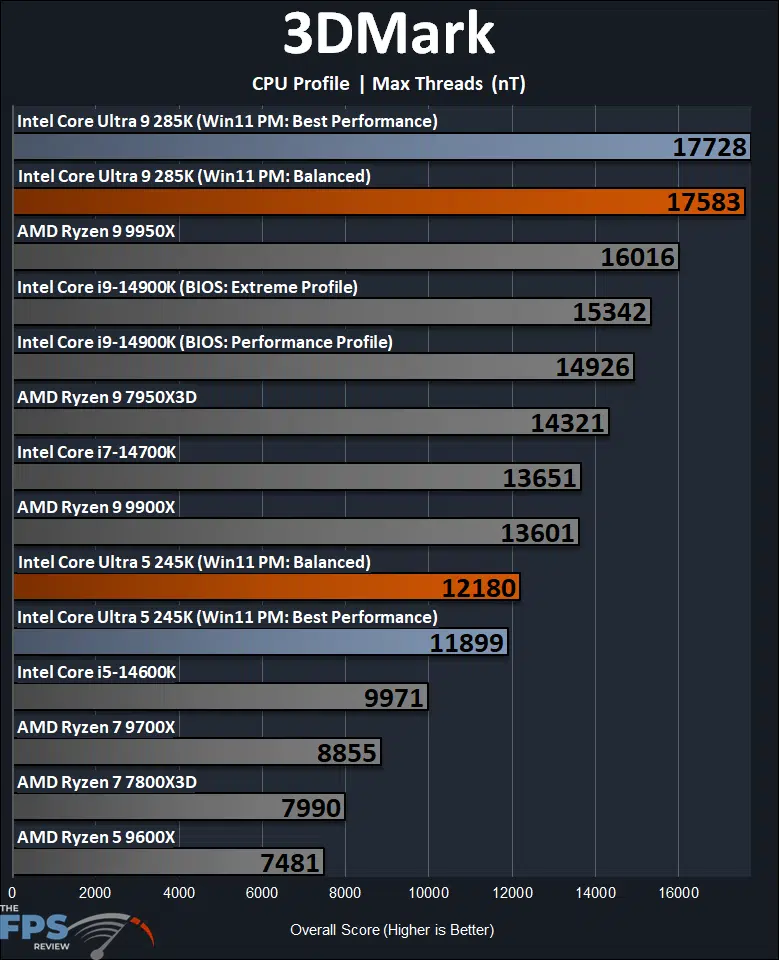
In 3DMark CPU Profile testing, with nT (multi-core) performance, we also see again that the power profile modes do cause a performance difference, but it is more minor than the single-core performance. Still, the Intel Core Ultra 9 285K is 1% slower in Balanced power profile, and the 245K actually flips around by 2% as well, with Balanced being faster than Best Performance.
Overall, this particular “Max Threads” test, indicates that the Intel Core Ultra 9 285K does quite well compared to the last generation and the competition. Even in “Balanced” power profile, the 285K is 15% faster than the 14900K, and 10% faster than the 9950X. The Intel Core Ultra 5 245K is also showing very well here, with it being 22% faster than the 14600K in “Balanced” profile, and 38% faster than the 9700X.
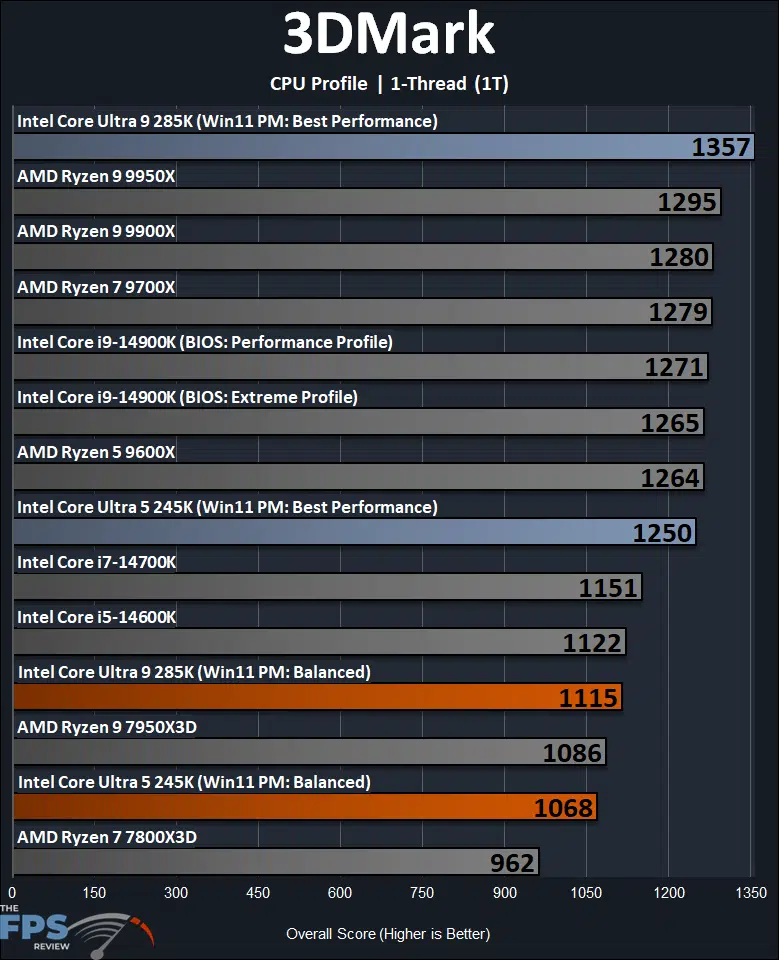
Once again, in the 1-thread (1T) single-thread testing, we see the devastating nature of the “Balanced” power profile on the Intel Core Ultra 200S series CPUs. The Intel Core Ultra 9 285K is 18% slower in Balanced power profile, and the 245K is 15% slower in Balanced.
Comparing like-to-like power profiles, the Intel Core Ultra 9 285K is 12% slower than the Intel Core i9-14900K, and 14% slower than the 9950X. The 245K is 5% slower than the 14600K and 16% slower than the 9700X. When we flip the 285K into the Best Performance power profile, however, that performance shoots up and now it is 7% faster than the 14900K and 5% faster than the 9950X (which were both on Balanced).