System Storage Benchmarks
For our SSD comparison today, we are going to include a series of lower-tier, first-generation, PCIe 4.0 x4 (Gen4) SSDs that operate in the 5000MB/s range of performance. This way, we can see how the TEAMGROUP T-FORCE G50 compares to other SSDs that perform within its range. There are faster Gen4 SSDs, but those are in a different class of SSD, and wouldn’t make sense in this comparison. The two noteworthy SSDs to compare with will be the MSI SPATIUM M470 and Lexar NM710 SSDs.
3DMark
We are using 3DMark’s Storage Benchmark which tests common gaming workload traces. The benchmark tests loading Battlefield V, Call of Duty Black Ops 4, and Overwatch. It tests moving games by copying a Steam folder for CS:GO, and installing Outer Worlds from the Epic Games Launcher, and saving game progress in The Outer Worlds. It tests recording a 1080p gameplay video at 60FPS with OBS while playing Overwatch. We will graph the Overall Benchmark Score, higher is better.
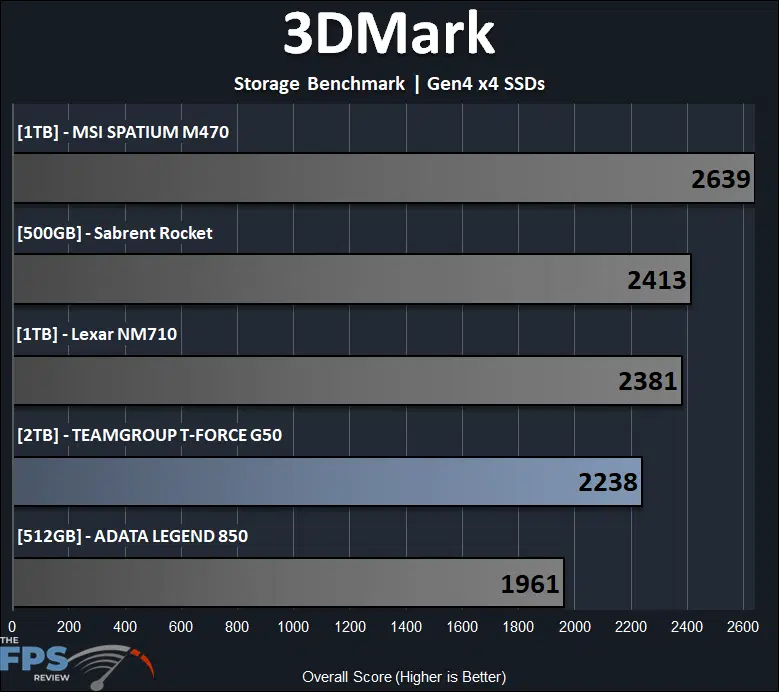
In our review, in the 3DMark Storage Benchmark, the TEAMGROUP T-FORCE G50 2TB PCIe 4.0 NVMe SSD scores 2238, which does put it behind most of the SSDs that are comparable by sequential performance in this generation. It is faster than the ADATA Legend 850 by 14%, but it is 6% behind the Lexar NM710 and 15% behind the MSI SPATIUM M470.
PCMark 10
We are using PCMark 10’s Full System Drive Storage Benchmark. It outputs an overall score (higher is better) that is derived from the Bandwidth (higher is better) as well as access time (lower is better) results.
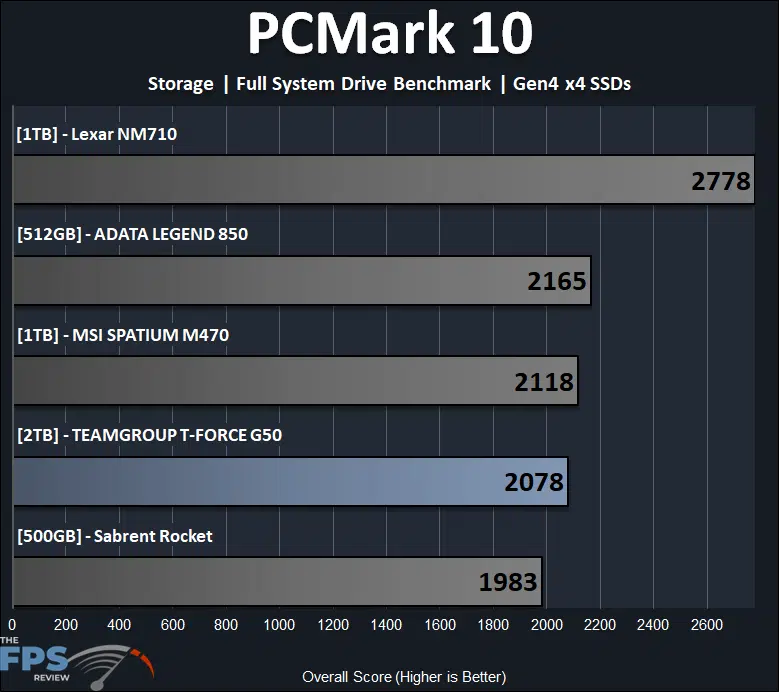
In PCMark 10’s full system drive storage benchmark, the TEAMGROUP T-FORCE G50 2TB PCIe 4.0 NVMe SSD also falls behind, but not as bad. It is faster than the Sabrent Rocket by 5% and is very close to the MSI SPATIUM M470 this time, but trailing it slightly. It is, however, 25% behind the Lexar NM710. The reason is shown below.
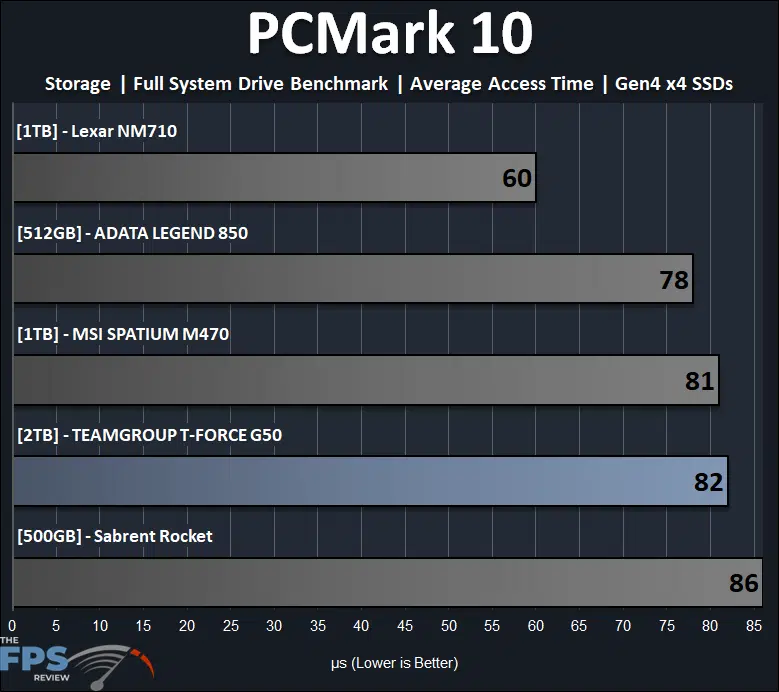
The average access time test in PCMark 10’s Storage Benchmark shows you a closer look at where things line up. The TEAMGROUP T-FORCE G50 2TB PCIe 4.0 NVMe SSD has a higher latency at 82, and this attributes to the lower PCMark 10 storage benchmark. It is right in-line with the MSI SPATIUM M470, but the Lexar NM710 has a much tighter access time, and this attributes to its higher performance in this benchmark.
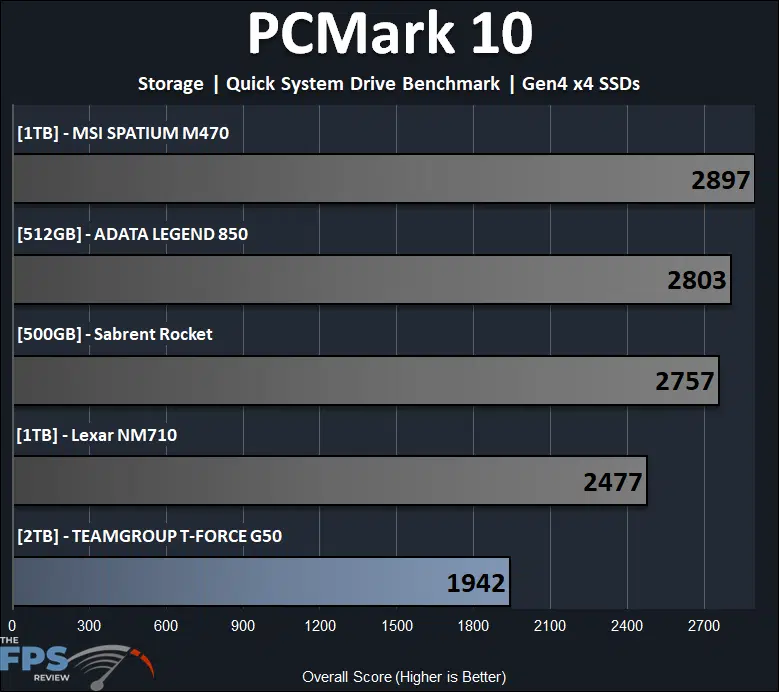
PCMark 10’s quick system drive storage benchmark focuses on smaller workloads, and typically this is where we see the benefit of a DRAM cache. Due to the lack of a DRAM cache, it is no surprise that the TEAMGROUP T-FORCE G50 2TB PCIe 4.0 NVMe SSD falls a bit flat in this benchmark, with the lowest performance. Similarly, the Lexar NM710 is behind in this benchmark, due to that fact as well. However, the TEAMGROUP T-FORCE G50 2TB PCIe 4.0 NVMe SSD falls even behind the Lexar NM710 by 22%, which is pretty big. It is clear the TEAMGROUP T-FORCE G50 2TB PCIe 4.0 NVMe SSD is not geared as a content creation type of SSD.
PassMark PerformanceTEST
We are using PassMark’s PerformanceTEST Disk Mark benchmark only. This test benchmarks Disk Sequential Read, Disk Sequential Write, IOPS 32KQD20, IOPS 4KQD1 tests and outputs an overall score (higher is better.)
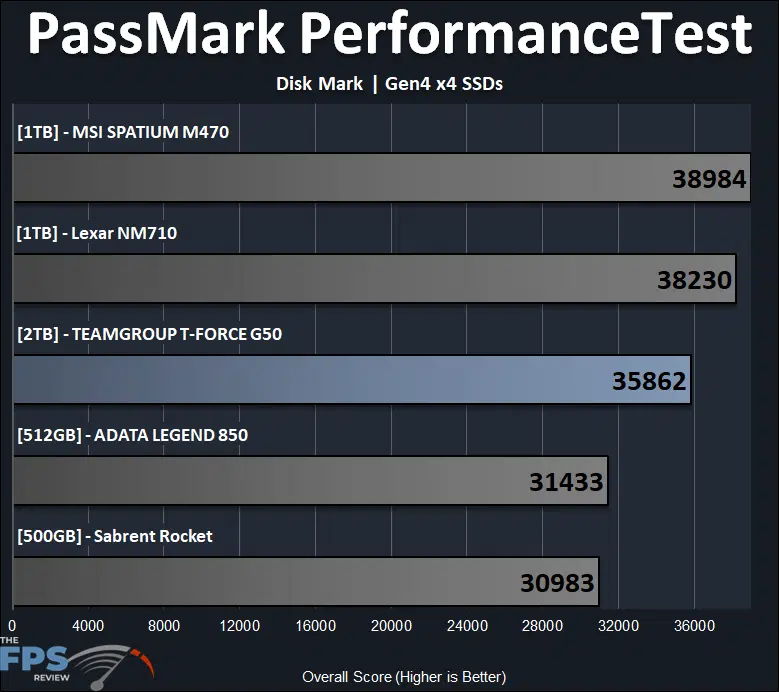
In PassMark PerformanceTest Disk Mark this benchmark takes everything into consideration, small workloads, large workloads, access time, and DRAM cache, and here the TEAMGROUP T-FORCE G50 2TB PCIe 4.0 NVMe SSD is about middle of the road. It is faster than the ADATA Legend 850 and Sabrent Rocket but is about 6% behind the Lexar NM710 and 8% behind the MSI SPATIUM M470.