System Storage Benchmarks
For our SSD comparisons, we are comparing similar PCIe Gen4x4 NVMe SSDs in this same performance tier of 7000MB/s read speed.
3DMark
We are using 3DMark’s Storage Benchmark which tests common gaming workload traces. The benchmark tests loading Battlefield V, Call of Duty Black Ops 4, and Overwatch. It tests moving games by copying a Steam folder for CS:GO, and installing Outer Worlds from the Epic Games Launcher, and saving game progress in The Outer Worlds. It tests recording a 1080p gameplay video at 60FPS with OBS while playing Overwatch. We will graph the Overall Benchmark Score, higher is better.
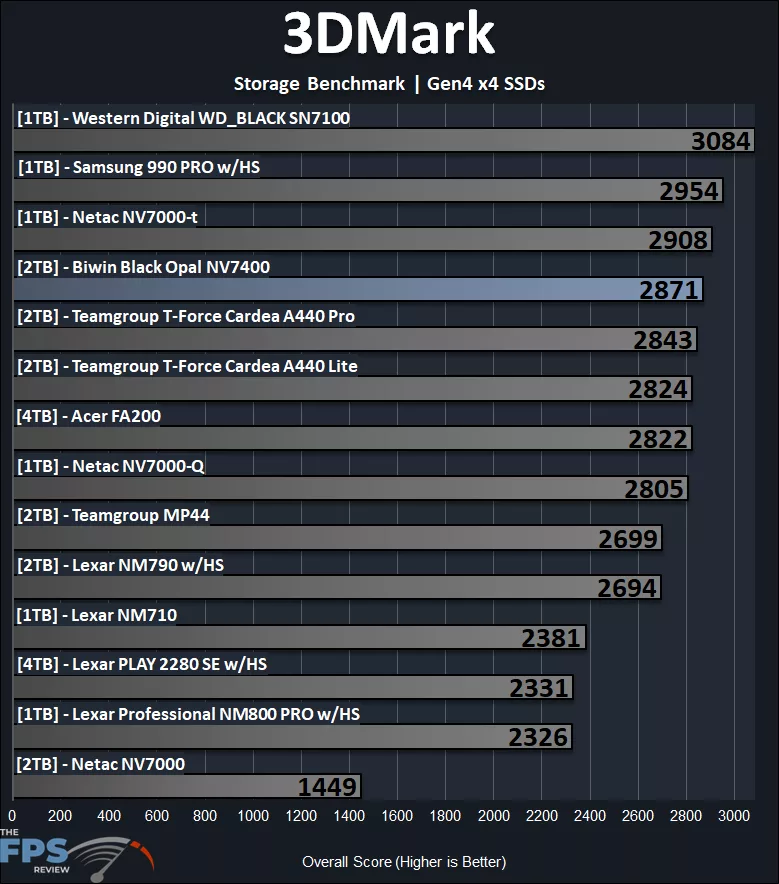
In 3DMark, the Biwin Black Opal NV7400 2TB SSD performs very well, fourth on the chart overall, so this is top-tier performance according to 3DMark’s storage test. The Biwin Black Opal NV7400 2TB SSD has an overall result of 2,871, which puts it slightly above the Teamgroup T-Force Cardea A440 Pro, A440 Lite, and above the Acer FA200 and Netac NV7000-Q. The Netac NV7000-t is slightly faster, and the Samsung 990 PRO and Western Digital WD_BLACK SN7100 stand out on their own. Overall, this is a positive result for the Biwin Black Opal NV7400 2TB SSD and shows that it does well in mixed gaming scenarios and content creation.
PCMark 10
We are using PCMark 10’s Full System Drive Storage Benchmark. It outputs an overall score (higher is better) that is derived from the Bandwidth (higher is better) as well as access time (lower is better) results.
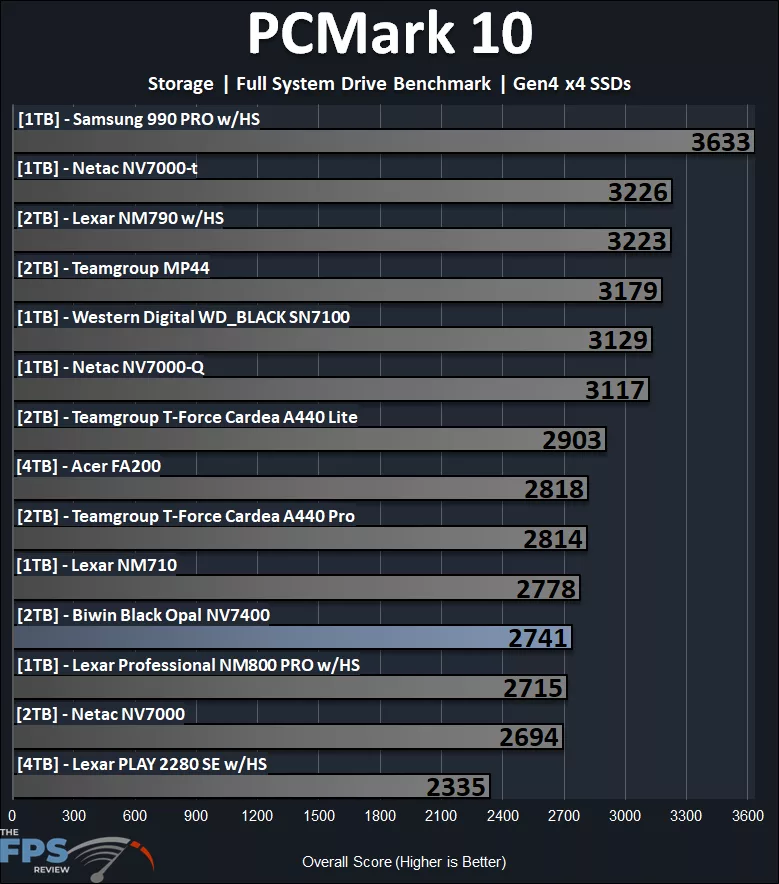
In PCMark 10’s full system drive storage benchmark, the Biwin Black Opal NV7400 2TB SSD is nearer to the bottom of the chart, fourth up from the bottom. Now, this is overall due to the access time, which you see in the graph below; access time weighs heavily on the result for PCMark 10’s full system drive benchmark. At this level, the Biwin Black Opal NV7400 2TB SSD is on par with the Lexar Professional NM800 PRO, with the Lexar NM710 slightly edging it out. It is faster than the Netac NV7000, though, and trounces on the Lexar PLAY 2280 SE. There are faster drives as you move up the graph, with again Western Digital and Samsung again being closer to the top-end of performance.
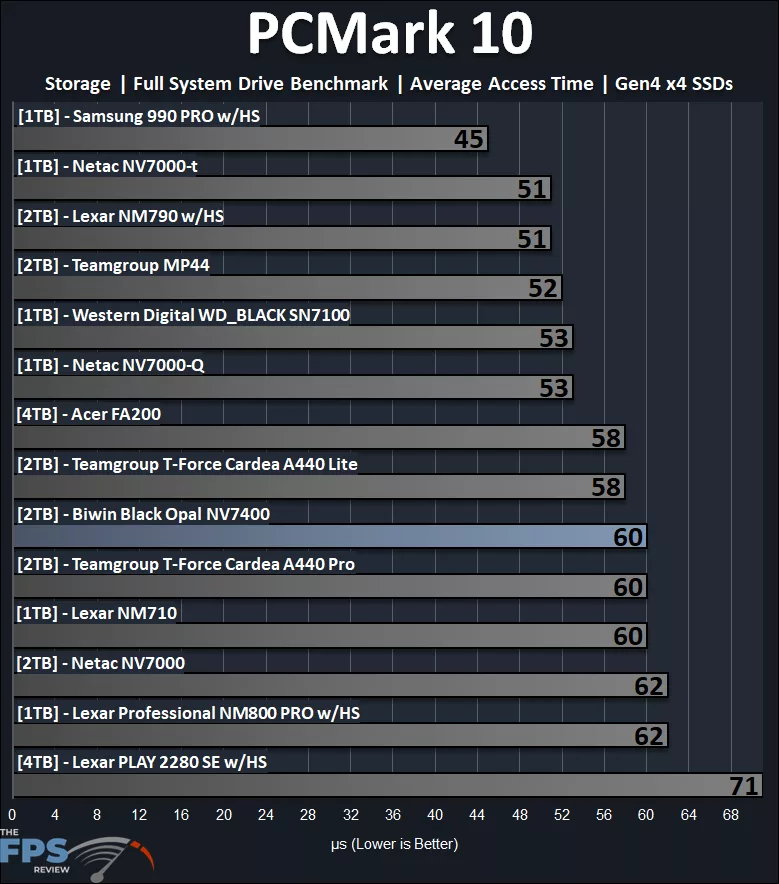
We can see that the access time in PCMark 10 is recorded at 60, which is a bit more toward the low-end, perhaps under the average, though there are some standout faster drives here. At 60, the Biwin Black Opal NV7400 2TB SSD is on par with several drives, the Teamgroup T-Force Cardea A440 PRO and Lexar NM710. It is close to the Netac NV7000 and Lexar Professional NM800 PRO, but again trounces on the Lexar PLAY 2280 SE. We can also see that there are many drives that are a lot faster, with Western Digital and Samsung closer toward the top again, and Samsung is really an outlier here.
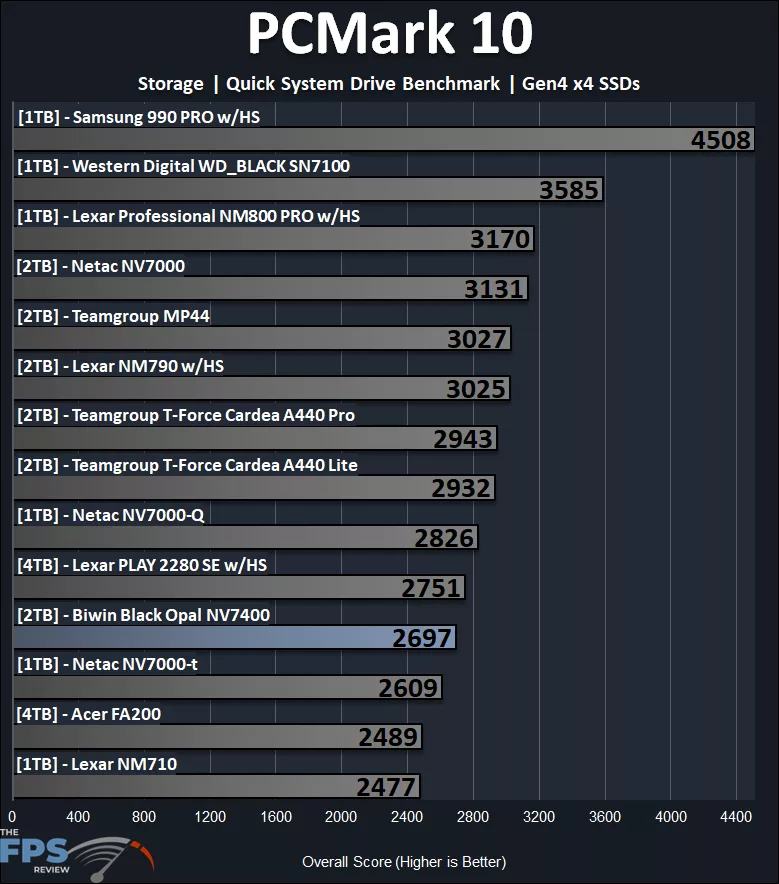
PCMark 10’s quick system drive storage benchmark focuses on smaller workloads, and typically, this is where we see the benefit of a DRAM cache. It is no surprise that without a DRAM cache, the Biwin Black Opal NV7400 2TB SSD performs as it does in this benchmark; this benchmark benefits from a dedicated DRAM cache for small workloads. The Biwin Black Opal NV7400 2TB SSD is under the average here, but it isn’t at the bottom; it does beat the Netac NV7000-t, Acer FA200, and Lexar NM710, and is close to the Lexar PLAY 2280 SE. There are faster drives; again, Western Digital and Samsung are on top.
PassMark PerformanceTEST
We are using PassMark’s PerformanceTEST Disk Mark benchmark only. This test benchmarks Disk Sequential Read, Disk Sequential Write, IOPS 32KQD20, IOPS 4KQD1 tests and outputs an overall score (higher is better.)
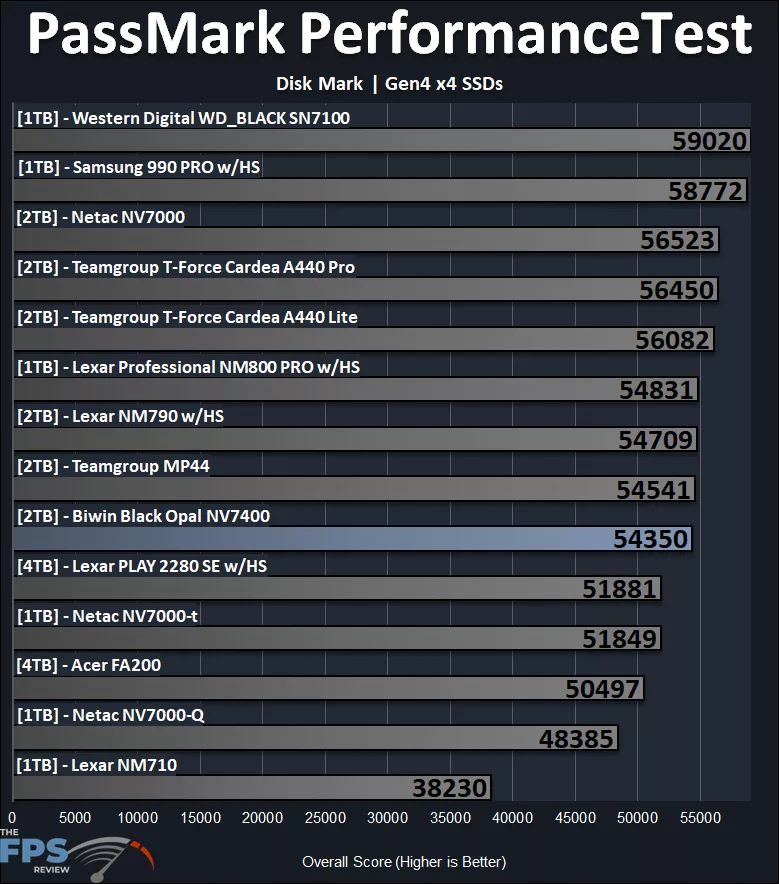
In PassMark PerformanceTest Disk Mark, this benchmark takes everything into consideration: small workloads, large workloads, access time, and DRAM cache. In this benchmark, the Biwin Black Opal NV7400 2TB SSD provides a score of 54,350, which sits just below the middle here on performance, close to the range of the Teamgroup MP44, Lexar NM790, and Lexar Professional NM800 PRO. It is faster than the Lexar PLAY 2280 SE, Netac NV7000-t, Acer FA200, Netac NV7000-Q, and Lexar NM710.