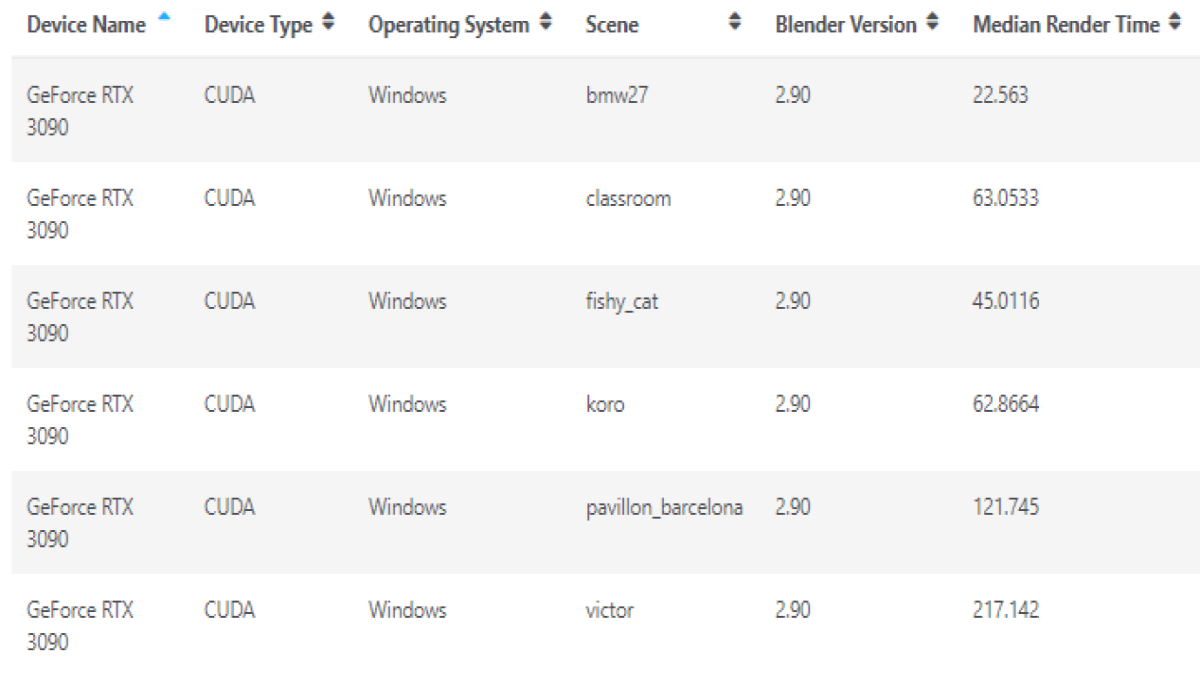
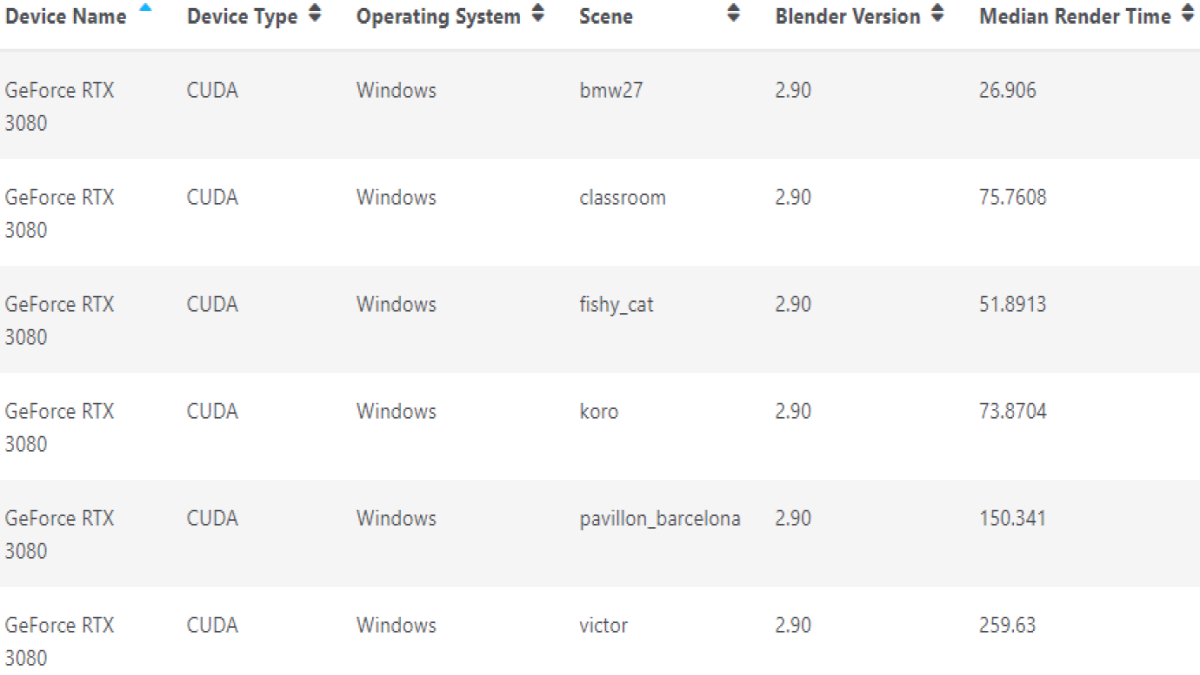
After days of seemingly subpar performance numbers being leaked about the GeForce RTX 3090’s scores in various benchmarks, it appears there’s one showing some greater gains. The latest one comes via Blender. In it, we see a number of different tests showing gains ranging from 15.3 percent to over 23 percent of the RTX 3080. However, that is only one part of this story. Once we examine how the RTX 3090 fares compared to the RTX 2080 Ti, things take a dramatic turn. Take a look at the actual scores below. All test scores were reported for Blender version 2.90. We’ll also take it a step further and compare these numbers to the previous Turing launch.
GeForce RTX 3090
GeForce RTX 3080
So, before we crunch these numbers, let’s take a look at the previous generation. In order to keep this as close to a like-for-like comparison, we’ll look at scores for both the GeForce RTX 2080 Ti and GeForce RTX 2080. We didn’t use the SUPER variant, as it is already believed another 3080 variant is in the pipeline.
GeForce RTX 2080 Ti

GeForce RTX 2080
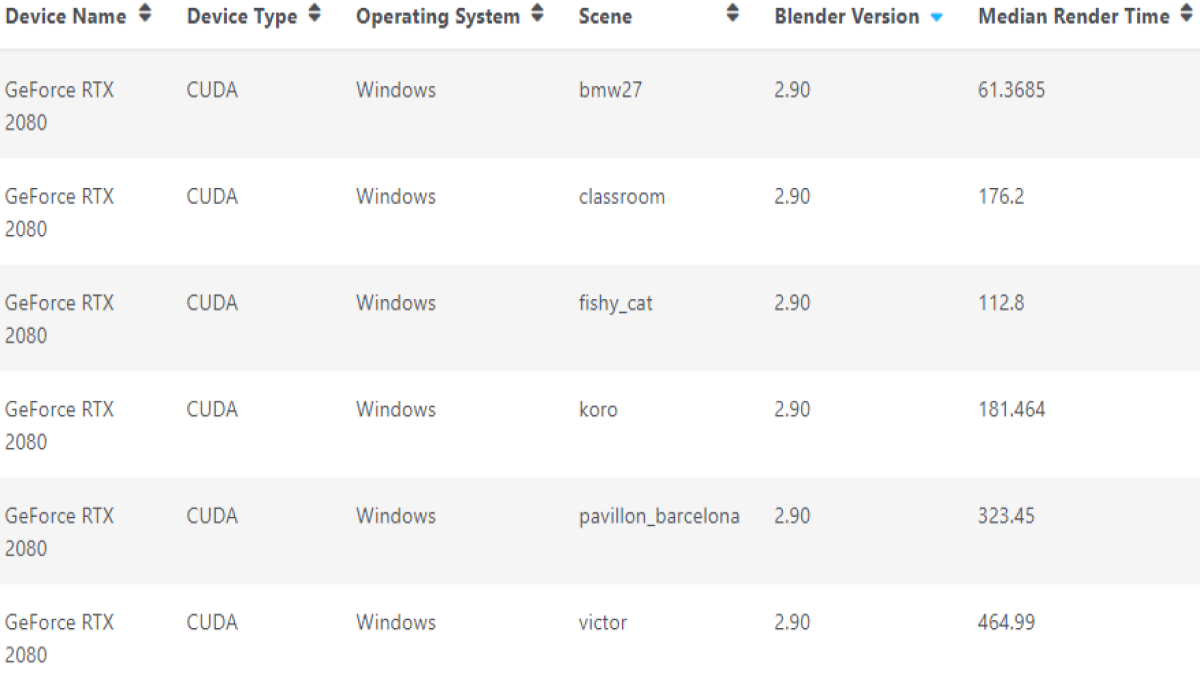
| Benchmark Test | GeForce RTX 3090 | GeForce RTX 3080 | Percent Faster | Geforce RTX 2080 Ti | GeForce RTX 2080 | Percent Faster | GeForce RTX 3090 vs GeForce RTX 2080 Ti | GeForce RTX 3080 vs GeForce RTX 2080 |
| bmw27 | 22.563 | 26.906 | 19.25% | 42.4618 | 61.3685 | 44.53% | 88.19% | 128.08% |
| classroom | 63.05333 | 75.7608 | 20.15% | 161.424 | 176.2 | 9.15% | 156.01% | 132.57% |
| fishy_cat | 45.0116 | 51.8913 | 15.28% | 83.2352 | 112.8 | 35.52% | 84.92% | 117.38% |
| koro | 62.8664 | 73.8704 | 17.50% | 125 | 181.464 | 45.17% | 98.83% | 145.65% |
| pavillon_barcelona | 121.745 | 150.341 | 23.49% | 255.012 | 323.45 | 26.84% | 109.46% | 115.14% |
| victor | 217.142 | 259.63 | 19.57% | 343.991 | 464.99 | 35.18% | 58.42% | 79.10% |
Ampere vs. Turing
At first, it would seem the gains by the RTX 3090 over the RTX 3080 are significant. However, when we look at the same comparisons for the previous Turing generation, things get a bit more interesting. In most of those tests, gains were more than double compared to the current-gen. Taking it a step further, and things get downright epic. The 3090 overtakes the 2080 Ti by a minimum of 58 percent in one test and over 156 percent in another, while the popular BMW test shows a gain of over 88 percent. It simply trounces the RTX 2080 Ti. Similarly, the RTX 3080 overtakes the RTX 2080 by a minimum of 79.10 percent and then over 145 percent. Once again, the newer Ampere cards crush their previous counterparts.
If the rumors about a 20 GB variant of the RTX 3080 are true, it becomes very doubtful why someone would want the RTX 3090 halo product for 4K gaming if they are considering the cost value. Although it does have increased CUDA, RT, and Tensor Cores, the VRAM could play a larger factor in gaming, as higher resolution textures will need it. Clearly, the RTX 3090 is seemingly a more affordable workstation GPU than a gaming GPU at this point. However, tests after tests are showing major gains over the previous Turing generation. No matter what, though, the RTX 3090 is proving to be the new king of the RTX lineup.