Have you ever wondered how much value you’ve truly gotten out of your mid-range GeForce cards? r/NVIDIA’s Hic-Sunt-Leones has drafted a chart that shows just how much each generation has provided in terms of performance per dollar.

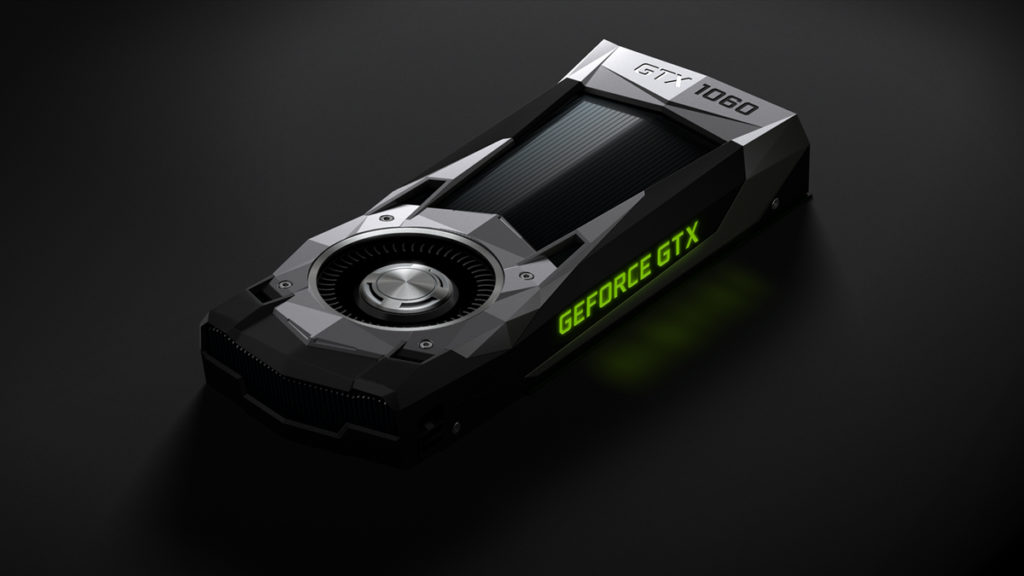
Quite clearly, the biggest winner here (of modern times, at least) is the Pascal microarchitecture, whose GTX 1060 (6 GB) provided a 53-percent improvement from the previous generation, Maxwell. The biggest loser is Turing, whose RTX 2060 provided a mere 19-percent increase over Pascal.
Plenty of GeForce GTX 1080 Ti owners have held on to that card to this day, and the numbers in this chart make it pretty clear as to why. Here’s how Hic-Sunt-Leones calculated the data:
- As stated performance data come from TechPowerUp. I took reference from the “Performance Summary” section you can find on each review on that website since 12 years ago. That shows a synthetic comparison between dozens of GPUs tested on several games.
- Not all the values are shown on a single table of course so you have to jump from one chart to the other calculating each single generational improvement and stack up all the results.
- Test resolution was kept as consistent as possible. GPUs were testes at 1900×1200 until GTX 460, then always at 1080p.
- Note that this comparison can’t take into account possible performance improvements over time due to new driver releases. Data come from the first review of the cards.
