During last week’s Zen 3 event, AMD suggested that its flagship Ryzen 5000 Series processor would be eating Intel’s for breakfast in both gaming and content creation. While those claims were strictly in-house (i.e., subject to shenanigans), we now have third-party metrics that suggest red team’s performance data is on point.
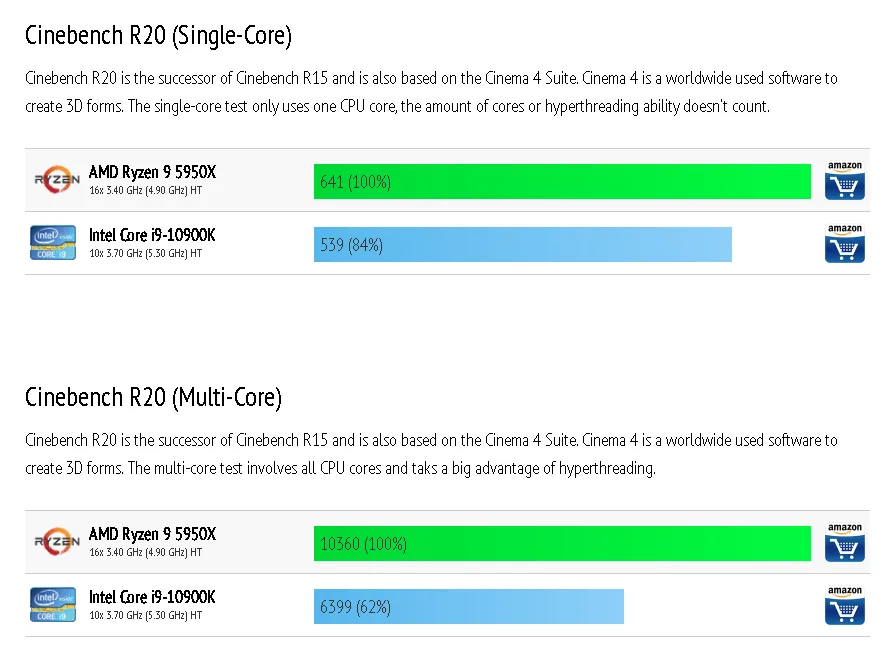
The first Cinebench R20 benchmarks for the Ryzen 9 5950X can be found on CPU Monkey (via Guru 3D), and they are definitely above and beyond what Intel’s flagship can muster. In the single-core test, AMD’s Ryzen 9 5950X scored 604, while the Core i9-10900KF only managed 539 (11 percent difference).
The multi-core test was also (unsurprisingly) in AMD’s favor, as its 16C/32T beast managed to achieve a score of 10,360. In comparison, Intel’s 10C/20T Core i9-10900KF only hit 6,399 (47 percent difference).
You can check out the rest of the comparisons below. AMD’s Ryzen 9 5950X (and the rest of the Ryzen 5000 Series lineup) will be released on November 5.
| CPU | Cores / threads | Base / boost (GHz) | R20 Single-Core | R20 Multi-Core |
|---|---|---|---|---|
| AMD Ryzen 9 5950X | 16/32 | 3.40 / 4.90 | 641 | 10,360 |
| AMD Ryzen 9 5900X | 12/24 | 3.70 / 4.80 | 629 | 8,168 |
| AMD Ryzen 7 5800X | 8/16 | 3.80 / 4.70 | 618 | 5,724 |
| AMD Ryzen 5 5600X | 6/12 | 3.70 / 4.60 | 604 | 4,312 |
| Intel Core i7-1185G7 | 4/8 | 3.00 / 4.80 | 598 | 2,477 |
| Intel Core i7-1165G7 | 4/8 | 2.80 / 4.70 | 561 | 2,234 |
| AMD Ryzen 7 3800XT | 8/16 | 4.20 / 4.70 | 539 | 5,122 |
| AMD Ryzen 9 3900XT | 12/24 | 4.10 / 4.70 | 539 | 7,244 |
| Intel Core i9-10900KF | 10/20 | 3.70 / 5.30 | 539 | 6,399 |
| Intel Core i9-10900K | 10/20 | 3.70 / 5.30 | 539 | 6,399 |