Synthetic Benchmarks
3DMark Time Spy
3DMark Time Spy is a benchmark that needs no introduction for the PC enthusiast community. This benchmark slowly being replaced with the newer Port Royal, but as of right now it’s still being used by many PC community members as a general performance indicator. Make no mistake about it either, Time Spy can still prove to be a solid indicator of potential video card performance.
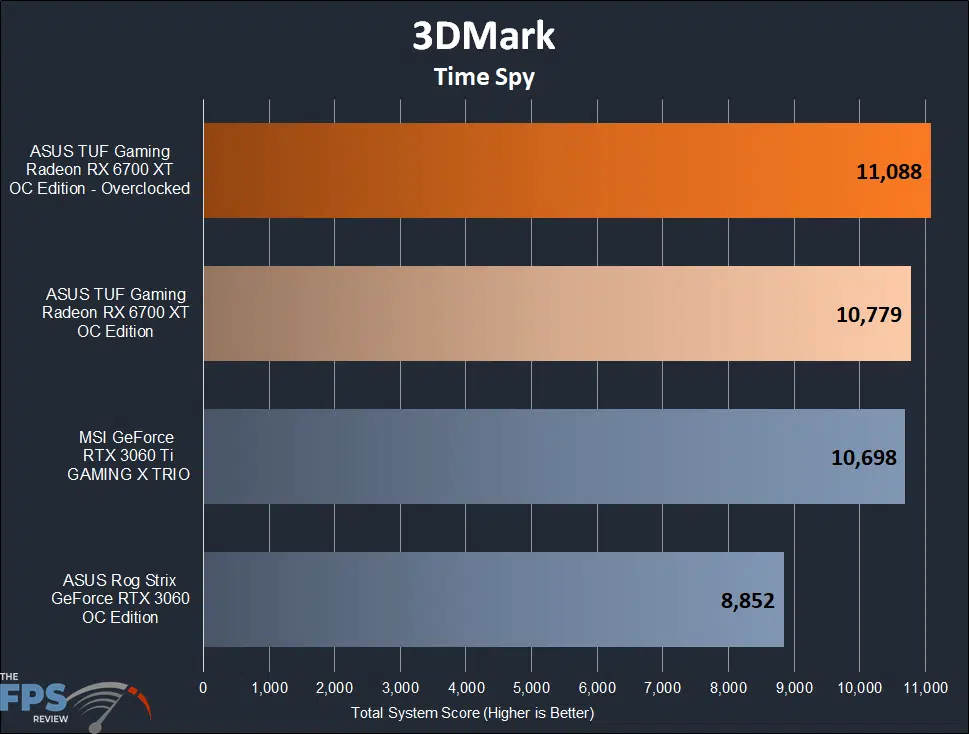
Our 3DMark Time Spy scores are fairly in line with what one might expect from the silicon in the ASUS TUF Gaming Radeon RX 6700 XT, with stock scores beating out both the competition cards. Without the overclock we saw a score of 10,779 points for our system after running 3DMark Time Spy. This win is minor as the MSI RTX 3060 Ti GAMING X TRIO was able to manage a score of 10,698 or a .75% difference.
The ASUS ROG STRIX RTX 3060 OC Edition was well behind both cards with a score of 8,852 as one might expect. Moving on to overclocking, our card managed to reach a score of 11,088 which is 3% faster than our stock result and 3.58% faster than the MSI RTX 3060 Ti GAMING X TRIO.
3DMark Port Royal
3DMark Port Royal is the latest and greatest benchmark available to download and it incorporates one of the biggest new visual fidelity features of the last few years, ray tracing. This test is stressful for any modern video card due to its heavy usage of ray tracing in all scenes. On most video cards this benchmark results in an absolute slideshow.
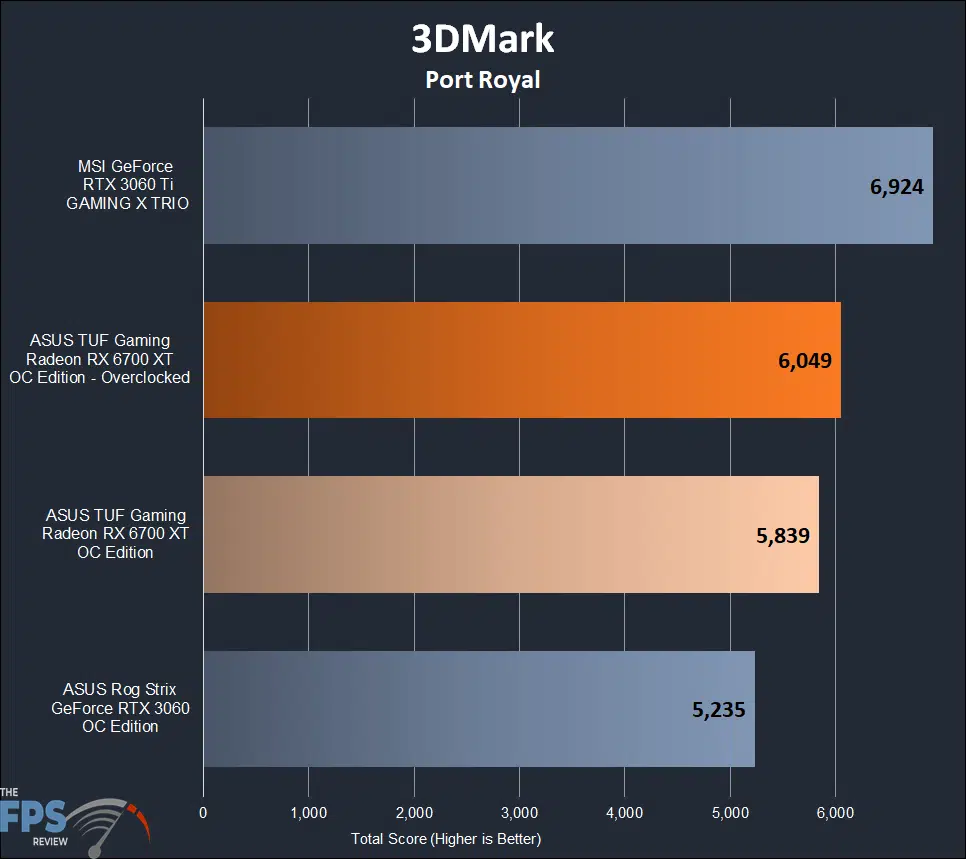
Next, we fire up 3DMark Port Royal and begin running our cards through their paces. The results we got allow us to see the first loss for our ASUS TUF Gaming Radeon RX 6700 XT. With 5,839 points at stock, we are behind the 6,924 points of the MSI RTX 3060 Ti GAMING X TRIO by a whopping 17%. Then we look at the ASUS ROG STRIX RTX 3060 OC Edition and observe it’s about 11% behind the more expensive ASUS TUF Radeon RX 6700 XT.
We turn to overclocking in order to see how much further we can push our RT performance here. With our profile loaded we ran the bench and got a score of 6,049 points, or 3.5% faster than we had originally. This score isn’t enough to catch up with the MSI card although it puts a dent in that 17% performance advantage, taking it down to a 13% advantage. We also saw the ASUS ROG STRIX RTX 3060 OC Edition’s lead fall to 7.5%.