Power and Temperature
To test the power and temperature, we broke up this testing into two parts, two scenarios. The first scenario is an “all-out” “maximum threads maximum performance” “full load” scenario. In this scenario, we run Cinebench R23 for 10 minutes and record the power and temperature. This shows the power and temp with the CPUs flat out, foot to the floor, pushing them as hard as possible. That provides one set of data.
Then, we run a more normal workload. You aren’t always running your CPU flat out, full bore, all the time. You are doing other things, like just playing a game. So we also wanted to look at the real-world power and temperature when doing something like just playing a game. So we fired up Cyberpunk 2077 and played it for 10 minutes at 1080p and “Ultra” settings on a GeForce RTX 3080 Ti, to stress the CPU as much as possible, not the GPU. Both of these scenarios show very different results, and both are relevant.
Maximum CPU Usage Cinebench R23
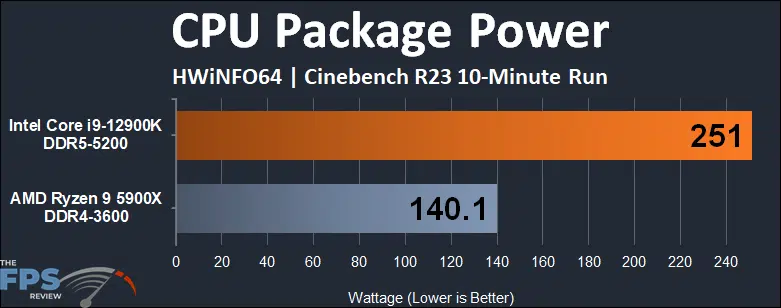
This is what we expected to see, we know the 12900K has a 241W Turbo Boost Power, and thus we are seeing a max here on this motherboard at default settings of 251W of power. Wow, that’s a lot, no doubt. The AMD Ryzen 9 5900X only consumes 140W by comparison. That means the 12900K needs 79% more power to be this competitive and outperform the 5900X, ouch. Intel is pushing it hard to hit these high frequencies.
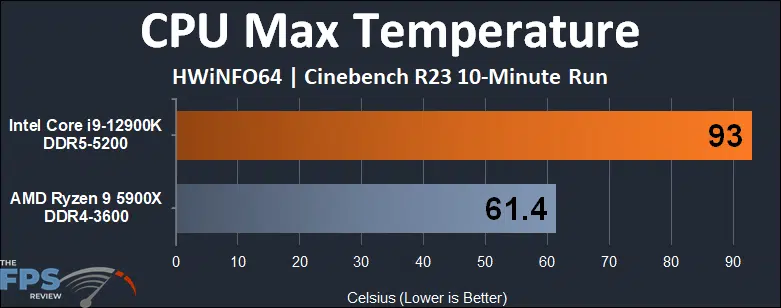
All that Wattage has to go somewhere, and it goes straight to thermal temperature. Even with a robust MSI MEG CORELIQUID S360 AIO Cooler at 100% pump and fan speeds our 12900K hit 93c at maximum CPU load for 10-minutes! Compare that to the 5900X which only hit around 62c. That means the 12900K got up to 51% hotter. The T-Junction for the 12900K is 100c, so we aren’t at its maximum temperature where it will throttle, but we are certainly darned close at full maximum CPU load.
CPU Usage While Playing a Game
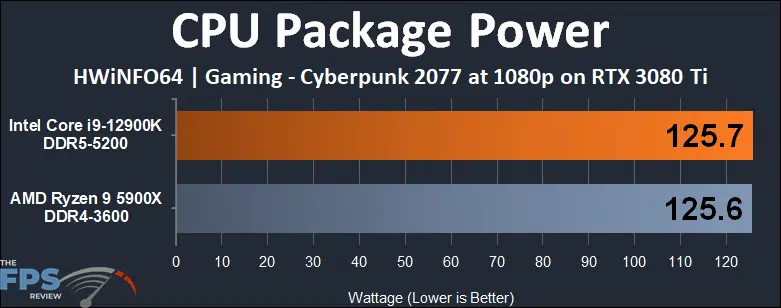
This right here is why it’s important to test the CPU in doing something other than pushing it to the maximum extreme limits. If you are just doing something simple, like playing a game, then the power usage between both CPUs is actually very similar. Neither one is a power hog while playing Cyberpunk 2077 at 1080p on an RTX 3080 Ti. The 12900K goes from a whopping 251W down to just 125W when playing a game, that’s nice, and therefore in a task like this, both CPUs are equal on power.
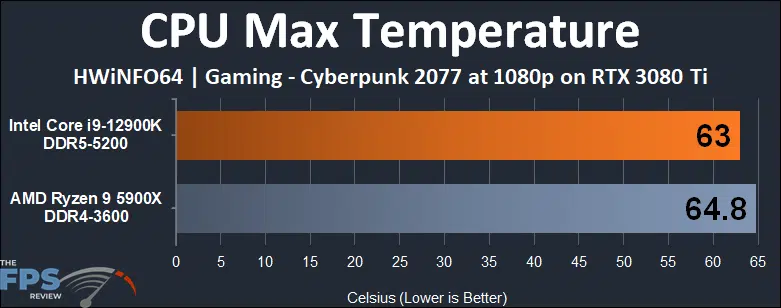
The temperature also comes way down on the 12900K when just playing a game. At a much lower 125W the CPU is at a great temp here, 63c and actually just a degree cooler than the 5900X. The 5900X actually runs a little warmer while gaming because it can run at a higher boost frequency while gaming, whereas on an all-core max CPU usage test, it runs at a bit lower frequency, thus the temp is more spread out and overall lower. It’s an interesting little thing, but the big takeaway here is how much the 12900K can be tolerable when playing games or doing office work or regular desktop workloads that don’t stress the CPU.