Geekbench
We are using Geekbench 5 and its Compute Benchmark which runs through a suite of compute-based synthetic tests. This benchmark tests OpenCL, CUDA, and Vulkan. It outputs a total score, and higher is better.
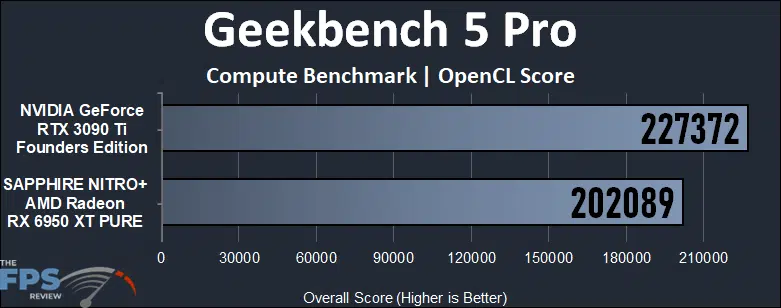
In the graph above OpenCL is being tested between the two video cards. In this test, the GeForce RTX 3090 Ti FE is 13% faster in OpenCL compute performance compared to the Radeon RX 6950 XT.
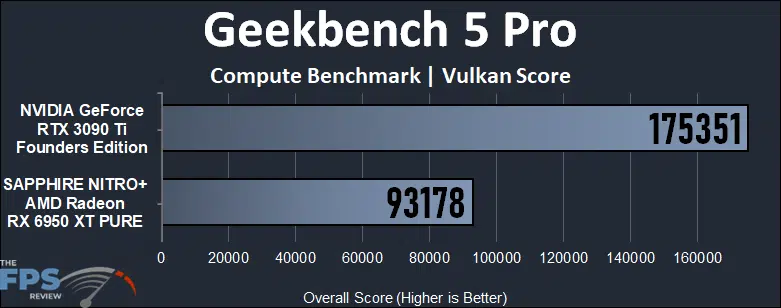
In the graph above Vulkan is being tested between the two video cards. In this test, the GeForce RTX 3090 Ti FE is a whopping 88% faster in Vulkan compute performance compared to the Radeon RX 6950 XT.
Also, for the sake of the comparison, we did run the test under CUDA on the GeForce RTX 3090 Ti FE. It scored 269253, which was much higher than the OpenCL score.
Blender Benchmark
We are using the Blender Open Data Blender Benchmark to benchmark how many samples per minute it takes to render the Blender scenes. The version of Blender being used is 3.2.0.
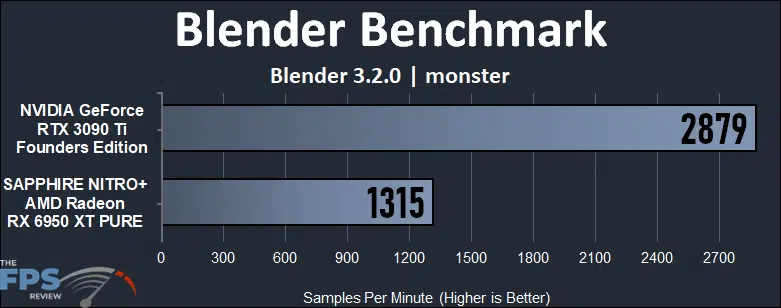
The new Blender Benchmark displays results in Samples per Minute, per scene, and higher samples are better. In the monster scene, the GeForce RTX 3090 Ti FE produces 119% more samples per minute and is a lot faster than the Radeon RX 6950 XT.
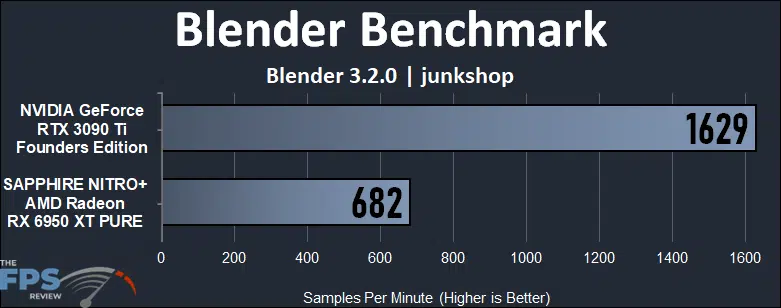
In the junkshop scene the GeForce RTX 3090 Ti FE is 139% faster than the Radeon RX 6950 XT.
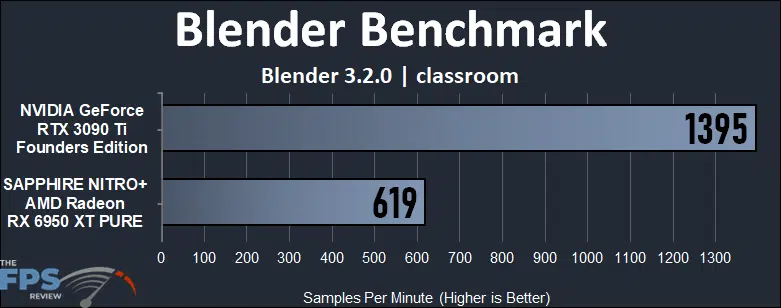
In the classroom scene the GeForce RTX 3090 Ti FE is 125% faster than the Radeon RX 6950 XT.
LuxMark v4.0
We are using the latest LuxMark 4.0 version, which includes path trace testing. The Hall Bench utilizes Path Tracing plus a Global Illumination cache. The Food scene utilizes brute force Path Tracing.
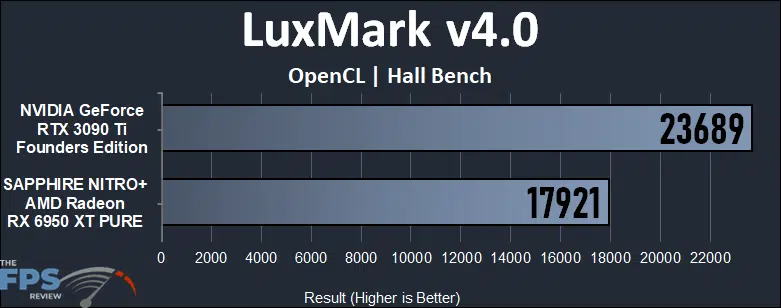
In the graph above we are testing the Hall Bench scene using OpenCL GPU only. The GeForce RTX 3090 Ti FE is 32% faster than the Radeon RX 6950 XT in this scene.
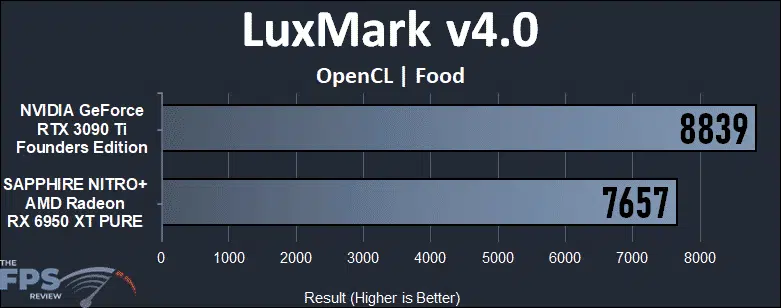
In the graph above we are testing the Food scene using OpenCL GPU only. In the food scene the GeForce RTX 3090 Ti FE is 15% faster than the Radeon RX 6950 XT.