
Synthetic System Benchmarks
We are going to start with synthetic system application benchmarks on this page. Note that the graphs are arranged with the Ryzen 9 7950X3D at the top, regardless of performance scaling. We have also highlighted it, to give you a better visual comparison to the Ryzen 9 7950X.
PCMark 10
PCMark 10 Express
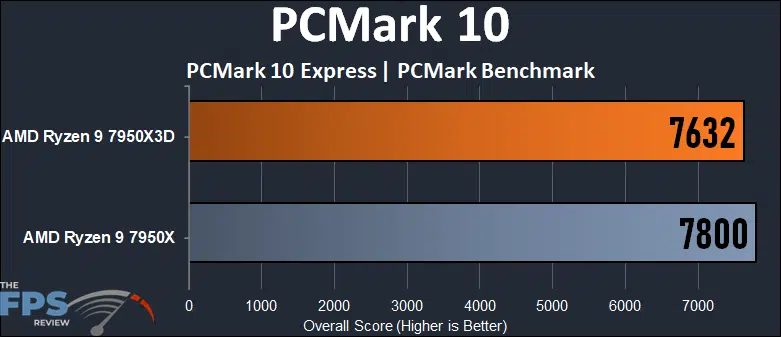
In PCMark 10’s Express Benchmark, the AMD Ryzen 9 7950X3D results in an overall system score of 7632, which is 2.1% slower than the Ryzen 9 7950X’s result of 7800. This overall system benchmark, which tests common office environment workloads in office applications, indicates that on average the Ryzen 9 7950X3D performs just under the Ryzen 9 7950X. Therefore the Ryzen 9 7950X is actually 2.2% faster than the Ryzen 9 7950X3D in these office workloads.
Geekbench 6
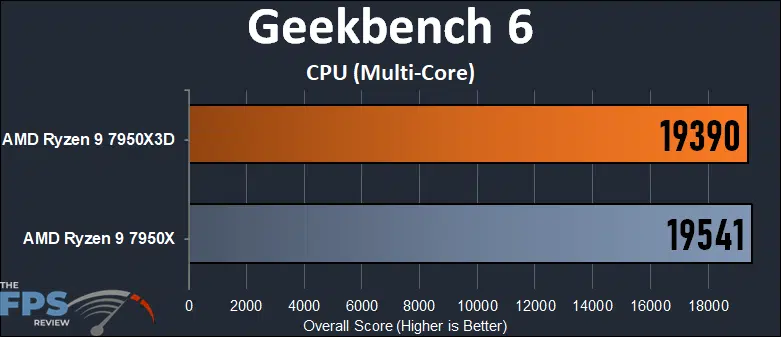
In Geekbench 6 Multi-Core performance, we also find that the AMD Ryzen 9 7950X3D falls under the Ryzen 9 7950X in performance. The Ryzen 9 7950X3D scores 19390, which is 1% below the Ryzen 9 7950X at 19541. Another way to look at this, the Ryzen 9 7950X is 1% faster than the Ryzen 9 7950X3D in multi-core performance in this overall system benchmark test of various workloads.
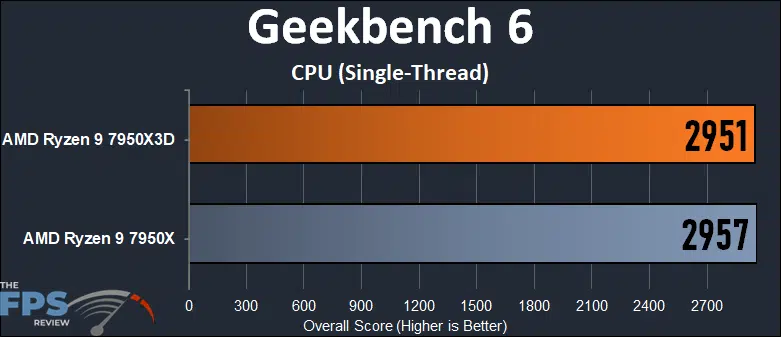
In Geekbench 6’s single-thread performance, the two CPUs are much closer in performance, with only a 0.2% difference. This shows that in single-thread performance, the Ryzen 9 7950X3D is actually the same performance (within the margin of error) as the Ryzen 9 7950X CPU, for single-threading performance.
3DMark CPU Profile
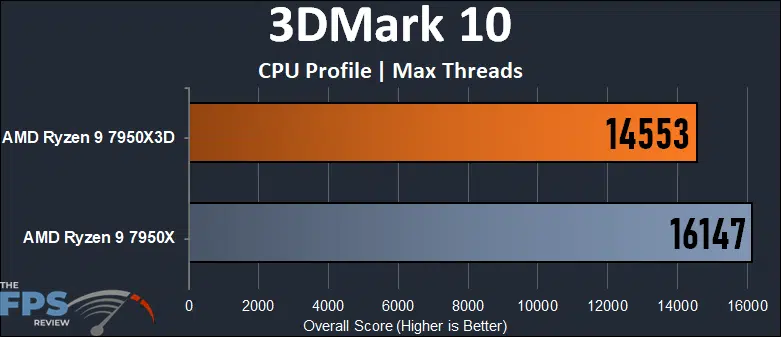
In 3DMark’s CPU Profile test, we are running the “Max Threads” test and looking at overall performance. This really shows the disadvantage of the Ryzen 9 7950X3D in maximum thread workloads versus the Ryzen 9 7950X. The Ryzen 9 7950X3D scores 14553, which is a whole 10% slower than the Ryzen 9 7950X at 16147. This makes the Ryzen 9 7950X 11% faster than the Ryzen 9 7950X3D when all cores and threads are being pushed to the max.
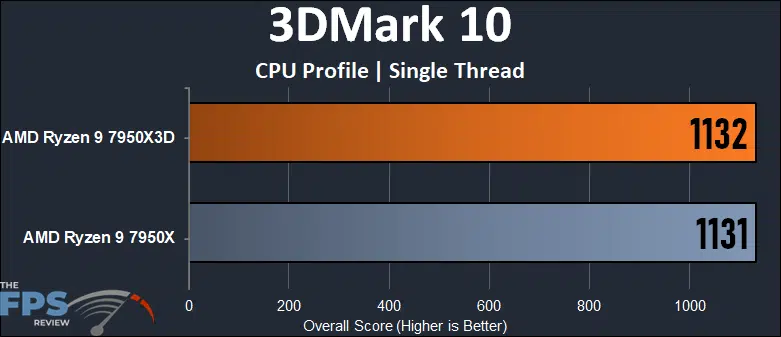
But, as we saw in Geekbench when it comes to single-thread performance the two CPUs are exactly the same in performance. This is due to the application utilizing the CCD without the 3D V-Cache, which can boost up to as high as the Ryzen 9 7950X.
Discussion (5 replies)
Join Discussion →So, question.
Here is a head to head comparison of two different items. The writeup is great and I think it's a very good article. But you have those Review Overview graphs at the bottom that list Performance/efficiency/features/value. So which of these two items in a head to head comparison does that graph pertain to? You may want to revisit that graph layout for head to head comparison type reviews.
It pertains to the 7950X3D. The first CPU in the title, is always the one that is the main focus, or the one being reviewed. I think from the tone of the review, as you read it, starting with the Introduction, I made it quite clear the 7950X3D is the focus of the review and the CPU that is being "reviewed". IMO, the text is very clear about which CPU is in question here. The conclusion also concludes with that comparison and focus. In addition, the "Summary" in the ranking system starts off with the very first line telling the reader what we did in the review: "In this application-focused review, we find out the overall big picture of the Ryzen 9 7950X3D when it comes to application performance." and the rest of it goes into explaining the ratings we chose, and why, for that CPU that it calls out. IMO, the intention is very clear.
I see what you're saying here. When doing a head to head include the overall score and short breakdown for each.... makes sense. Also makes sense to only do the title card.
Oh I also wanted to add, good review enjoyed reading it and feel more informed. I'll be waiting for the next generation CPU's from AMD before I talk upgrade. Or maybe skip two depending on motherboard, ram and storage costs.
That is what the "Summary" section does at the bottom of every page, to explain the rankings.