Synthetic System Benchmarks
On this page, we will show synthetic benchmarks, some that test a variety of system use-case scenarios, and others that test specific multi-core and single-core/thread workloads to hone in on performance differences. Note that the graphs are arranged from fastest to slowest, and the bars highlighted in blue are with Microcode 0x129 in place, while the grey bars are the previous BIOS version without the Microcode fix.
Geekbench 6
We are using Geekbench version 6.3.0 for our testing. We will show Multi-Core (nT) and Single-Core (1T) performance in separate graphs.
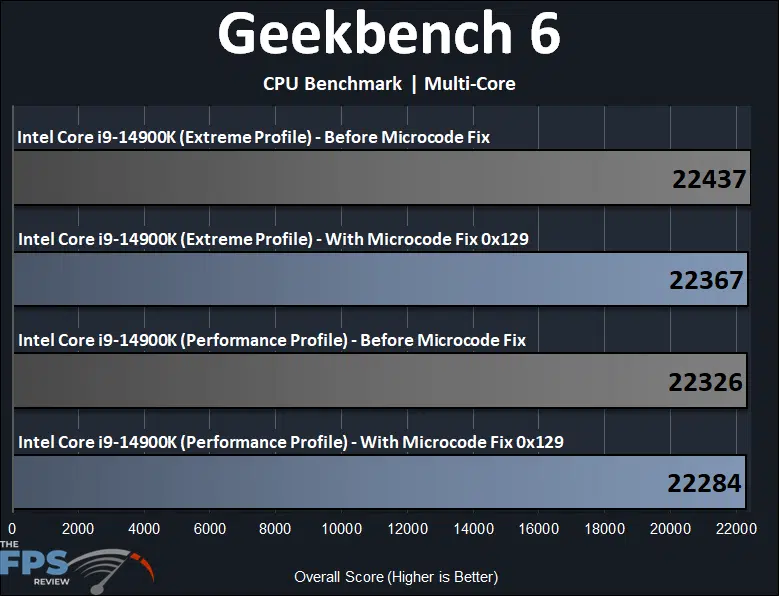
According to Geekbench Multi-Core testing, installing the BIOS with the Intel Microde Fix 0x129 reduces performance by just 0.3% in the Extreme Profile mode. In the Performance Profile mode, the new Microcode Fix 0x129 decreases performance by just 0.18%. Therefore, there is no significant downgrade or change in performance in this Multi-Core test in Geekbench 6.

In Geekbench 6’s Single-Core performance testing, the Intel Core i9-14900K in the Extreme Profile with the Microcode Fix 0x129 decreases performance only by 0.15%. In the Performance Profile, the Microcode Fix 0x129 decreases performance only by 0.15% as well. Therefore, at least according to Geekbench, there is no significant change in single-core performance.
3DMark CPU Profile
We are testing 3DMark’s CPU Profile which tests Max Thread performance and Single Thread performance, we are reporting both on separate graphs.
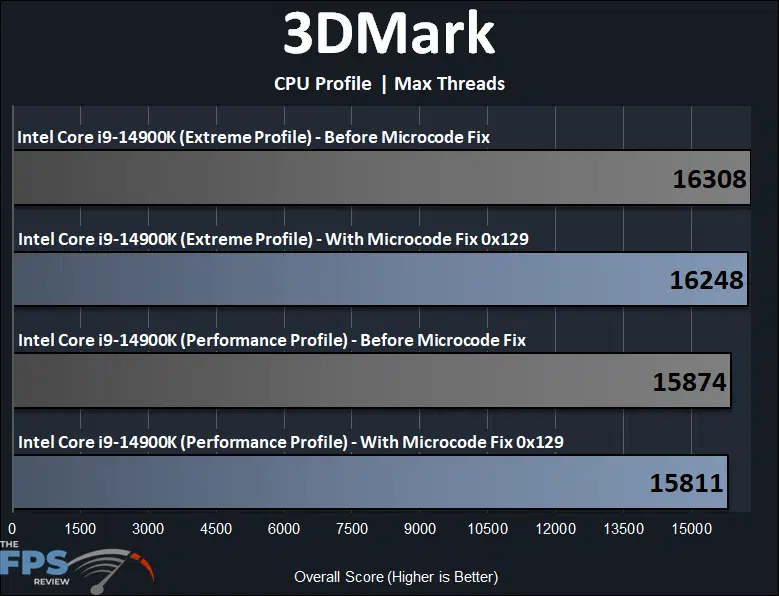
In 3DMark’s CPU Profile test, the Intel Core i9-14900K with the Microcode Fix 0x129 applied reduces performance by a small 0.36% in the Extreme Profile. In the Performance Profile, there is a slightly higher benchmarkable, difference of 0.39% by applying the Microcode Fix 0x129. Overall, these numbers are rather insignificant in performance differences.
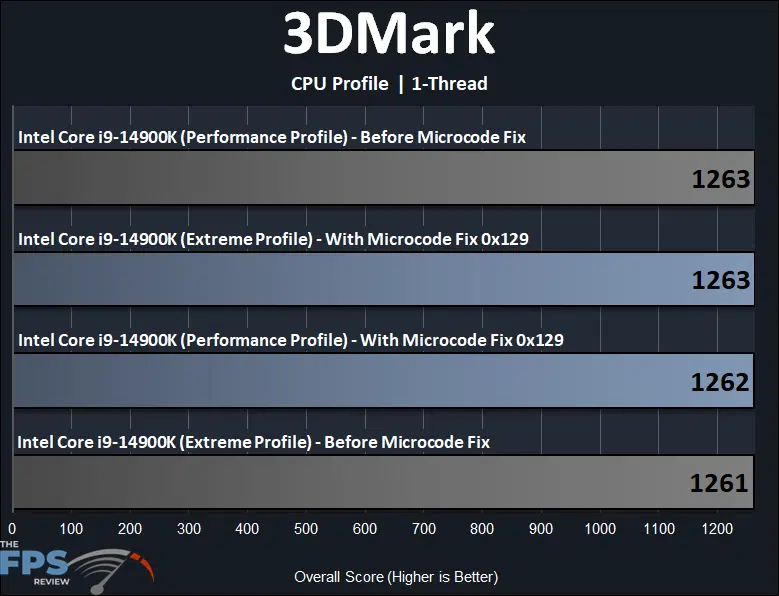
In 3DMark’s 1-Thread testing, we find that the Microcode Fix 0x129 has the exact same performance as before the update, in the Extreme Profile. In the Performance Profile, there’s just a 1-point difference with the Microcode Fix 0x129 update, so no change really.
PerformanceTest 11
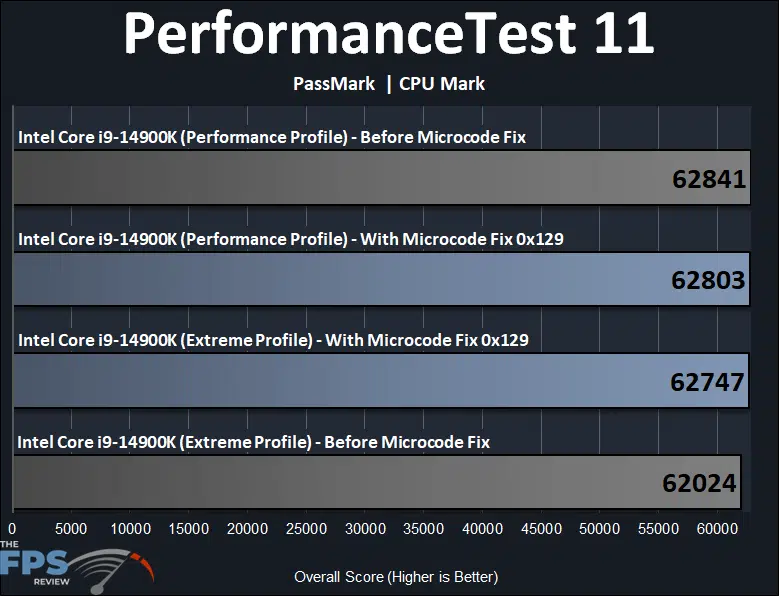
In PassMark PerformanceTest 11 CPU Mark test, the Intel Core i9-14900K in the Extreme Profile actually gains performance with the Microcode Fix 0x129 applied by 1.1%. In the Performance Profile, the difference is only 0.06%, so it’s the same performance overall.