Gaming Performance Continued
Now we come to the interesting testing we are sure you all can’t wait for, we were also anxious to get to this part and see how it all ends up for gaming performance. We are testing only at 1080p, to isolate CPU performance. We are using an NVIDIA GeForce RTX 4090 Founders Edition video card with driver version 565.90. All games are being run in their “Ultra” game settings, at native 1080p resolution, and with no ray tracing. In some games, we have set the desktop also to 1080p for Windowed/Borderless Window games.
Importantly, we are using ALL manual run-throughs for every game here, not a single built-in benchmark was used, these are all manual run-throughs actually in the game, playing the game. We have also included testing on the 285K and 245K in the Windows 11 Power Mode profiles of “Balanced” and “Best Performance” as well, for gaming, since we found that it makes a difference in performance. Every other CPU comparison on the graph was tested in the “Balanced” Power Mode profile. In the graphs “Win11: PM” stands for Windows 11 Power Mode.
Cyberpunk 2077
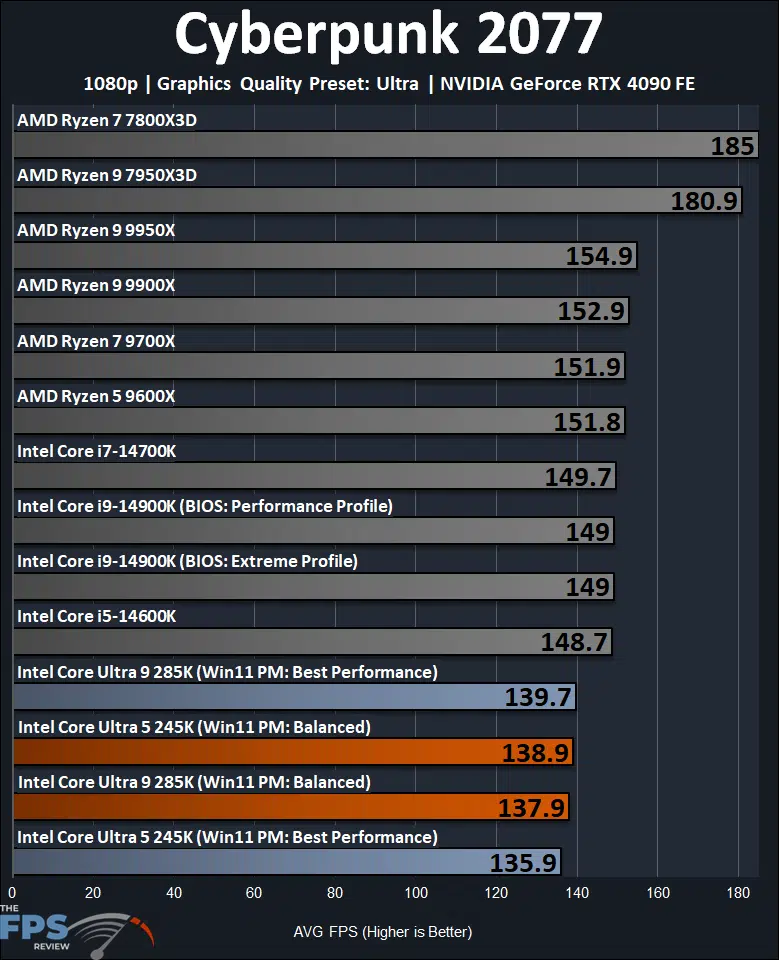
The common pattern we explained on the previous page, shows itself again. Overall, it is clear to see where the Intel Core Ultra 200S series CPUs sit in this game. The Intel Core Ultra 9 285K at like-for-like Windows 11 Power Mode profile settings is 7% slower than the previous generation Intel Core i9-14900K. This puts it 11% behind the AMD Ryzen 9 9950X on performance in this game. The Intel Core Ultra 5 245K is 7% slower than the Intel Core i5-14600K and 9% slower than the 9700X and 9600X.
The AMD Ryzen 9 7950X3D and AMD Ryzen 7 7800X3D CPUs take a commanding lead in performance. The AMD Ryzen 7 7950X3D is a whopping 29% faster than the Intel Core Ultra 9 285K. The AMD Ryzen 7 7800X3D is a scary 33% faster than the Intel Core Ultra 5 245K.

We also experienced odd performance degradation in Cyberpunk 2077 on both the Intel Core Ultra 9 285K and Intel Core Ultra 5 245K. Simply put, there were sections in the game where performance would start to drag, down into the upper 60’s FPS on both CPUs and then would go back up into the 100’s out of those areas. It seems there are some sections of the game with heavy NPCs and the like, that cause a major drain on performance. We think it is related to how the game threads are being divided between P-Cores and E-Cores. We can confirm this because Cyberpunk 2077 has a game feature in the options menu that lets you select P-Cores as a preference. We tried it, and you’ll see the result below.
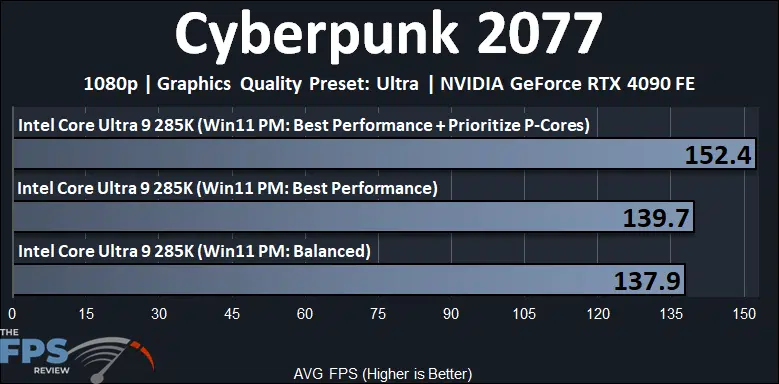
In the graph, we can see that enabling Cyberpunk’s special “Prioritize P-Cores” option it has in the Utilities menu, improves performance quite a bit in this game. We see a 9% performance increase using the Prioritize P-Core option, compared to leaving it on its default “Auto” setting. Indeed, in those scenes we talked about above where performance started to slow down, it no longer occurred when this option was enabled, proving that there are thread scheduling issues. At 152 FPS, performance now exceeds the 14900K by 2%.
Dying Light 2
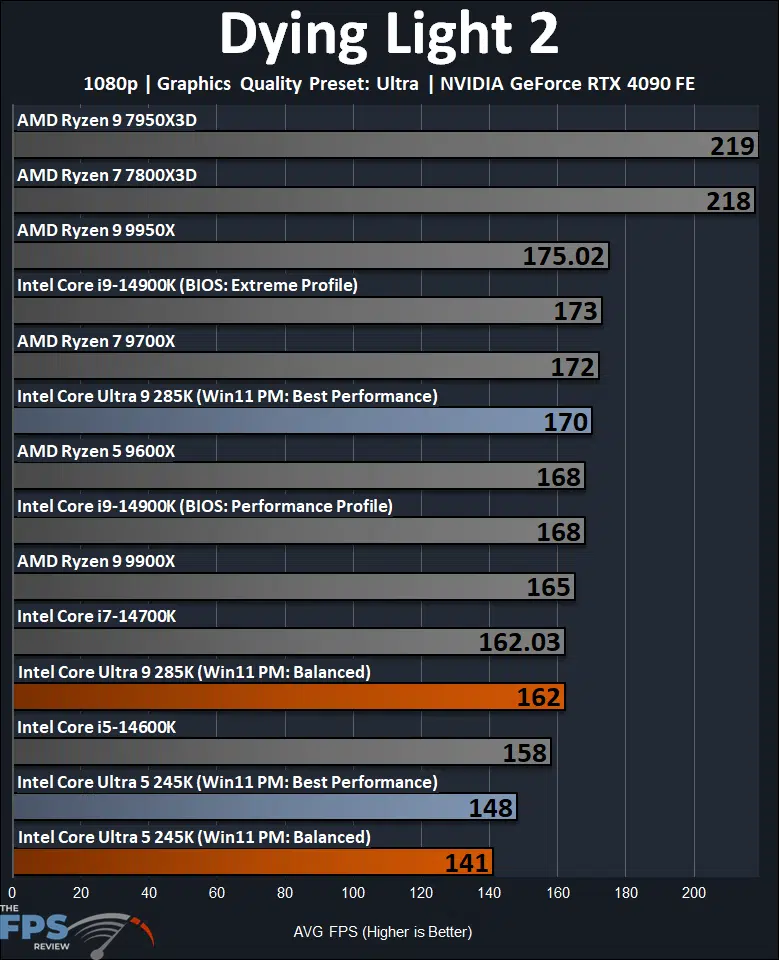
Dying Light 2 reveals a familiar pattern. Firstly, in this game, there was a distinct performance difference between the “Balanced” Power Mode profile and “Best Performance.” We can see that the Intel Core Ultra 9 285K is 5% slower in the Balanced power profile mode, and the 245K is also 5% slower.
When we compare like-for-like power profile mode settings, the Intel Core Ultra 9 285K is 6% slower than the Intel Core i9-14900K in its default BIOS power profile. The Intel Core Ultra 9 285K is therefore 7% slower than the AMD Ryzen 9 9950X. The Intel Core Ultra 9 245K is 11% slower than the Intel Core i5-14600K and a large 18% slower than the 9700X and 16% slower than the 9600X.
When we use the Best Performance power profile mode the 285K is still slightly 2% behind the 14900K, and 3% behind the 9950X. The 245K is 6% behind the 14600K and 14% behind the 9700X and 12% behind the 9600X.
The AMD Ryzen 9 7950X3D and AMD Ryzen 7 7800X3D take the lead in performance by a great deal. They are 29% faster than the Intel Core Ultra 9 285K at its best, and 48%!!!!!! faster than the Intel Core Ultra 5 245K.
Hogwarts Legacy
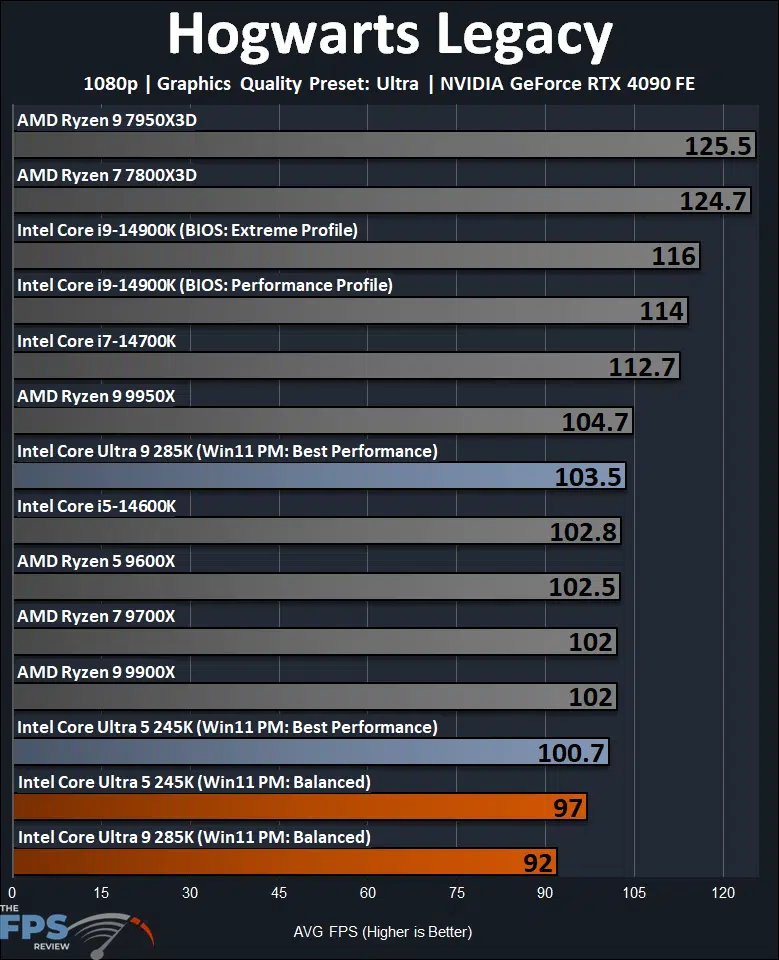
In Hogwarts Legacy, we do see a difference once again between the “Balanced” and “Best Performance” Power Mode profiles. The Intel Core Ultra 9 285K is 11% slower in Balanced and the 245K is 4% slower.
In like-for-like power profile modes, the Intel Core Ultra 9 285K is 21% slower than the 14900K and 12% slower than the 9950X. The Intel Core Ultra 5 245K is 6% slower than the 14600K and 9700X and 9600X.
In the Best Performance power profile mode the Intel Core Ultra 9 285K matches parity, sort of, with the AMD Ryzen 9 9950X on performance. However, it is still slower than the Intel Core i9-14900K by 11%, which is quite large. The Intel Core Ultra 5 245K is 2% slower than the 14600K and 9700X and 9600X.
The AMD Ryzen 9 7950X3D and AMD Ryzen 7 7800X3D CPUs are the fastest. The Ryzen X3D CPUs are around 21% faster than the Intel Core Ultra 9 285K at its fastest, and faster than the 245K by 24% at its fastest.
Starfield
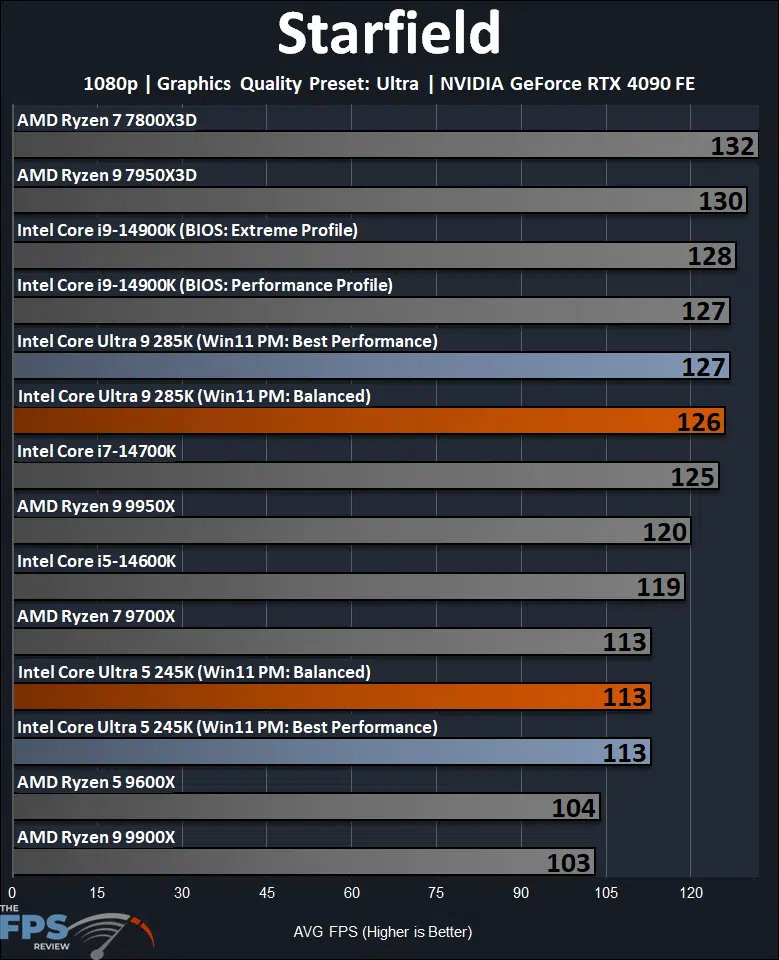
We find AMD CPUs don’t do as well as expected in this particular game, especially dual-CCD parts. The Intel Core Ultra 9 285K seems to be on par, or a frame slower on average, than the previous generation Intel Core i9-14900K. Since the Ryzen 9 9950X doesn’t do particularly well in this game, the Intel Core Ultra 9 285K, for the first time, ends up being 6% faster.
The Intel Core Ultra 5 245K suffers a lot, however, in this game. The Intel Core Ultra 5 245K is 5% slower than the Intel Core i5-14600K. It’s on par, or parity with the Ryzen 7 9700X, but does offer a performance advantage over the 9600X at 7%, which is decent.
The Ryzen 7 7800X3D is the fastest CPU in this game and ends up being 4% faster than the Intel Core Ultra 9 285K and 17% faster than the Intel Core Ultra 5 245K, which is quite a large range in this game.