
PassMark has updated its graph showing year-on-year performance of CPUs tested via its PerformanceTEST benchmark, and with it comes the news that CPU performance has seemingly reached a performance plateau as of late, with the company having recorded its first yearly drop in average CPU performance since it began tracking the topic—an effort that it started over 20 years ago, in 2004.
“The chart is composed of data from PerformanceTest V5 to the V11. PerformanceTest V8 (released 2012) was the first version to collect single thread performance,” PassMark explained before posting a graph that includes the latest results for year-on-year CPU performance, one that shows a 3.4% and 0.5% drop for the desktop and laptop segments, respectively, in the current year.
PassMark CPU Performance Averages
- Desktop
- 2024: 26,436 points over 186,053 samples
- 2025: 26,311 points over 47,810 samples
- Laptop
- 2024: 14,632 points over 101,316 samples
- 2025: 14,130 points over 25,541 samples
Year on Year Performance (Updated February 10, 2025)
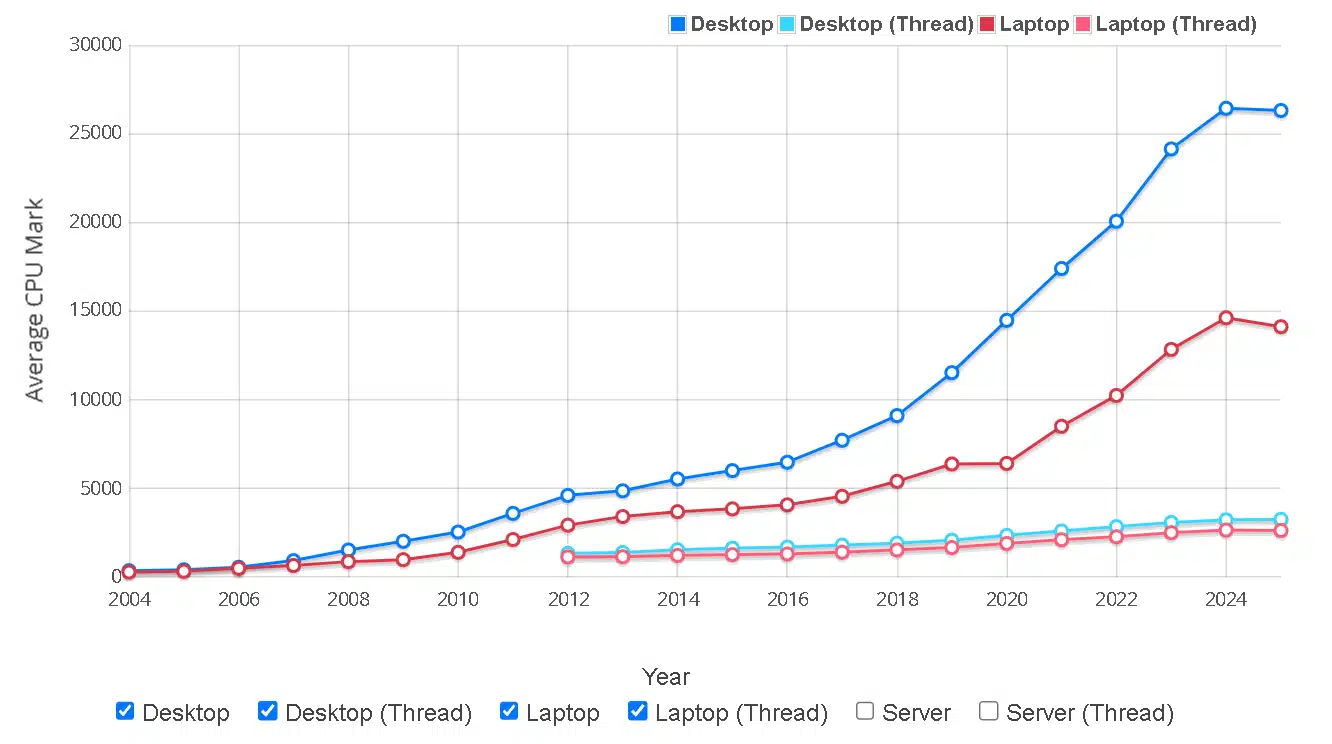
- This graph counts the baselines submitted to us during these time period and therefore is representative of CPUs tested during this time.
- The years are by the calendar year. (i.e. starts January 1st and ends December 31st)
- Baselines can be submitted from anywhere therefore these are global statistics.
- This chart only includes CPUs installed into PCs and does not include game consoles.
- Prior to 2021…
- …this chart only includes x86 processors and does not include other chip architectures. ARM processors are included from 2021 onwards.
- …PerformanceTest software only runs on Windows OS and counts on user submitting their benchmarks. This chart may be non reflective of non Windows user base before this date. PerformanceTest CPU Tests were Standardized across platforms (Windows, Linux, Mobile) in 2021.
- As the chart is updated bi-weekly, but the data point that may change is for the current year. The first few days or weeks of a new year are less accurate compared to the end of a year.
- The chart is composed of data from PerformanceTest V5 to the V11. PerformanceTest V8 (released 2012) was the first version to record single thread performance.
Top CPU Performance to Date (Updated February 10, 2025)
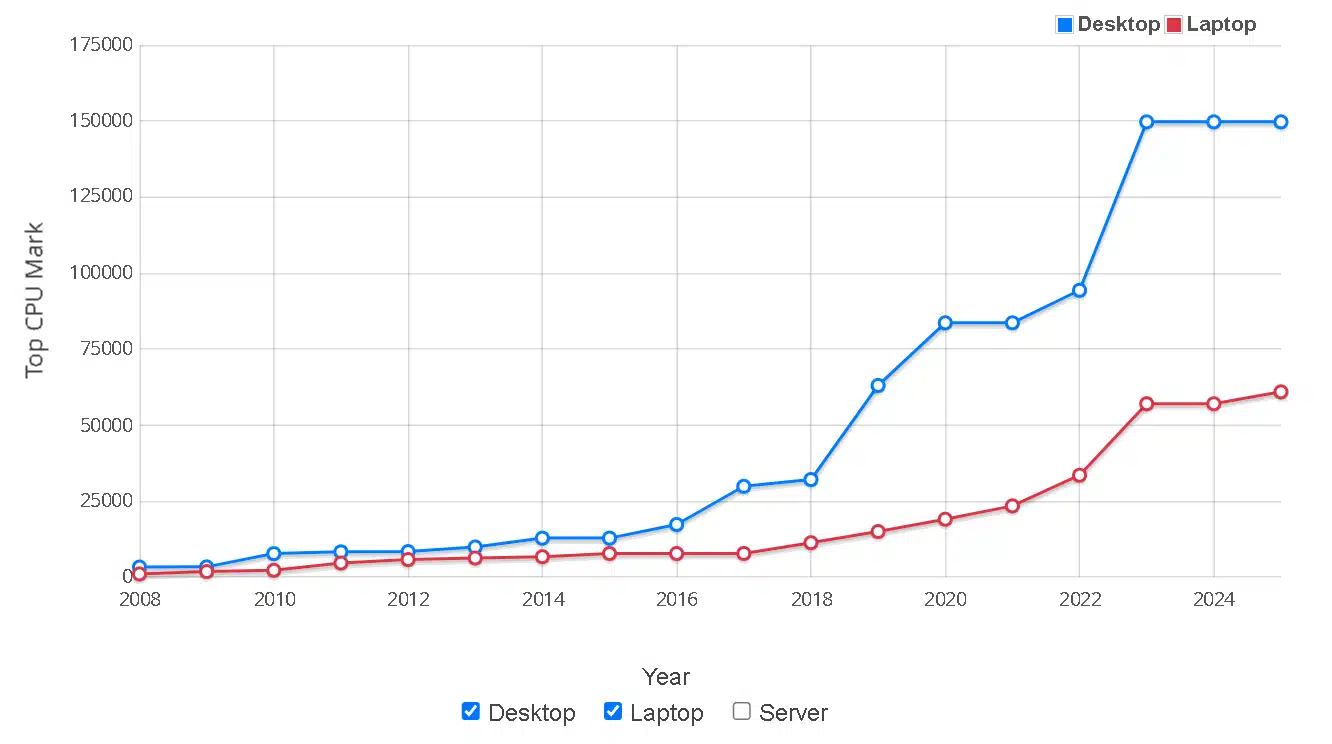
- This graph shows the average of the top performing CPU to date within the Calendar Year submitted by users.
- The years are by the calendar year. (i.e. starts January 1st and ends December 31st)
- Baselines can be submitted from anywhere therefore these are global statistics.
- This chart only includes CPUs installed into PCs and does not include game consoles.
- Prior to 2021…
- …this chart only includes x86 processors and does not include other chip architectures. ARM processors are included from 2021 onwards.
- …PerformanceTest software only runs on Windows OS and counts on user submitting their benchmarks. This chart may be non reflective of non Windows user base before this date. PerformanceTest CPU Tests were Standardized across platforms (Windows, Linux, Mobile) in 2021.
- As the chart is updated bi-weekly, but the data point that may change is for the current year. The first few days or weeks of a new year are less accurate compared to the end of a year.
- The chart is composed of data from PerformanceTest V8 to the V11.