Power and Temp
On this page, we will look at the power and temperature of the Overclocked ASUS PRIME GeForce RTX 5070 Ti. The power and temperature will be dependent on the specific brand, model, and SKU of each custom AIB GeForce RTX 5070 Ti. Each model employs different cooling and power targets, though they do share a common base TDP for the GeForce RTX 5070 Ti. This will show the potential of power and temperature, with a reference clocked GeForce RTX 5070 Ti. We will utilize both GPU-Z and HWiNFO64 to collect data and look at the sensor information they both provide. We collected the data running Cyberpunk 2077 at 1440p and “Ultra” settings.
Power
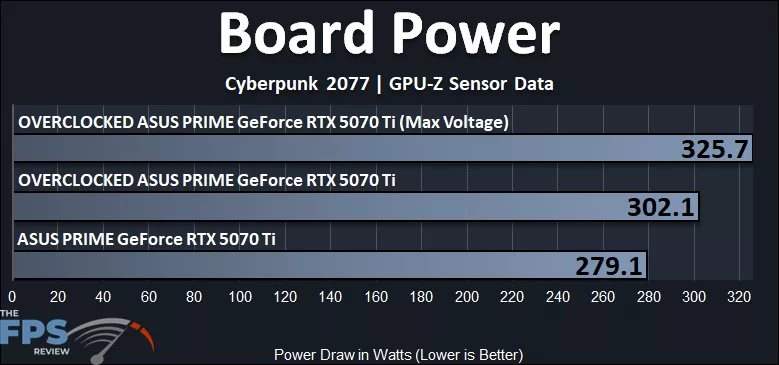
In this first graph, we are looking at the total overall Board Power as indicated by GPU-Z while gaming. The maximum peak Wattage on the ASUS PRIME GeForce RTX 5070 Ti is 279W, and when we overclock it without adding Voltage, that increases by 8% to 302W. If we add in our test with the Maximum Voltage applied, that increases another 8% up to 325W total board power. The default TDP of a GeForce RTX 5070 Ti reference video card is 300W, so by default, the ASUS PRIME GeForce RTX 5070 Ti is running under that, but when overclocked, we hit the top-end of the TDP. With the Voltage applied, we exceed the TDP at 325W, which is allowed thanks to the higher Power Target range ability.
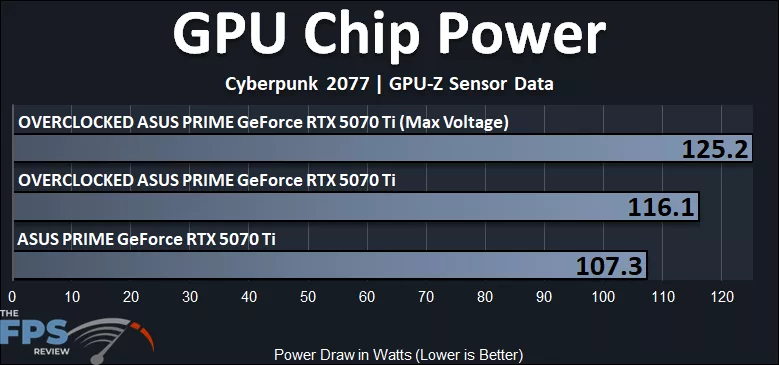
In this graph above, we can look at just the GPU Chip Power, not the board power. The default GPU Chip power of the ASUS PRIME GeForce RTX 5070 Ti is 107W, and when we overclock the GPU, that increases by 8% to 116W, and when we add Voltage, that increases another 8% to 125W.
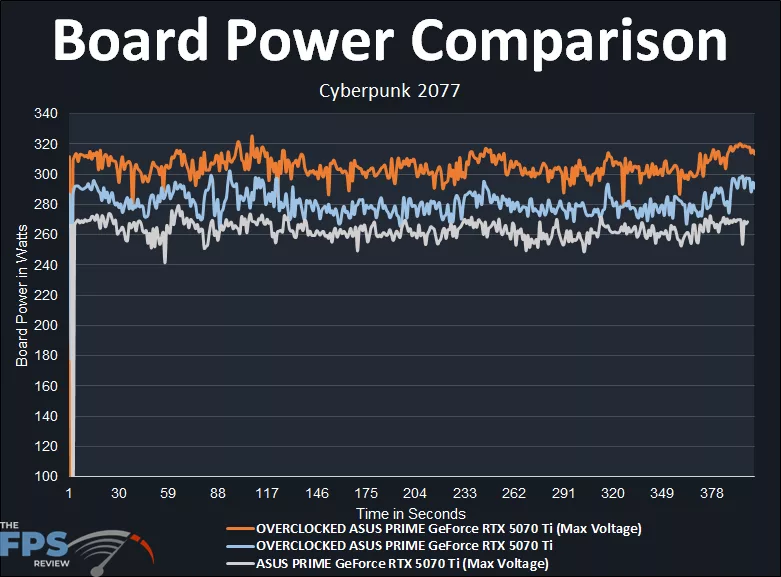
In this graph above, we can see another way to visualize the total Board Power of the ASUS PRIME GeForce RTX 5070 Ti over time. This shows a very clear linear power progression from default, to Overclocking, to adding max Voltage, taking the total video card from the 260W range, up to the above 300W-320W range when fully overclocked.
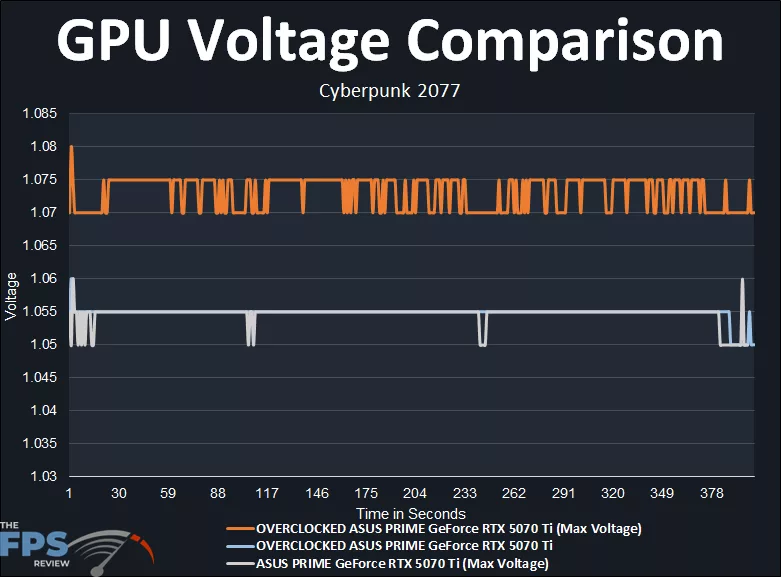
In this graph above, we can visualize the GPU Voltage over time. By default, and Overclocked the GPU Voltage matches and is averaging around 1.055V at default on the ASUS PRIME GeForce RTX 5070 Ti. When we maximize the GPU Voltage to 100%, that increases the GPU Voltage to 1.07-1.075V, while gaming, an increase of 2% higher Voltage in capability.
Temperature
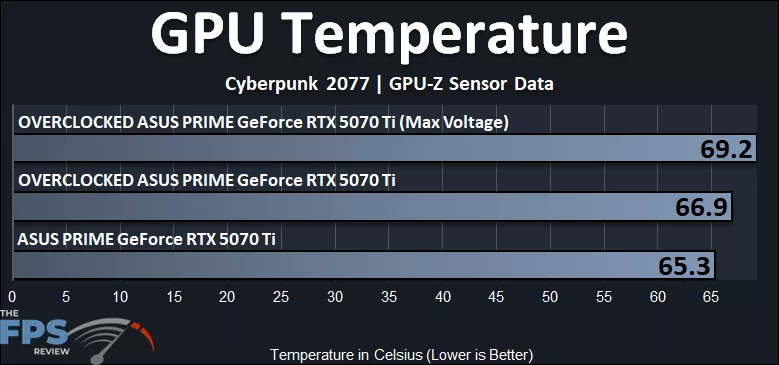
GPU temperature is going to be entirely dependent on the model of GeForce RTX 5070 Ti. The ASUS PRIME GeForce RTX 5070 Ti runs very cool at just 65c GPU Temp at default. Overclocking only increases that by a degree, and with Max Voltage, the total temperature increase is only 6% higher. This is with the fans on automatic control.
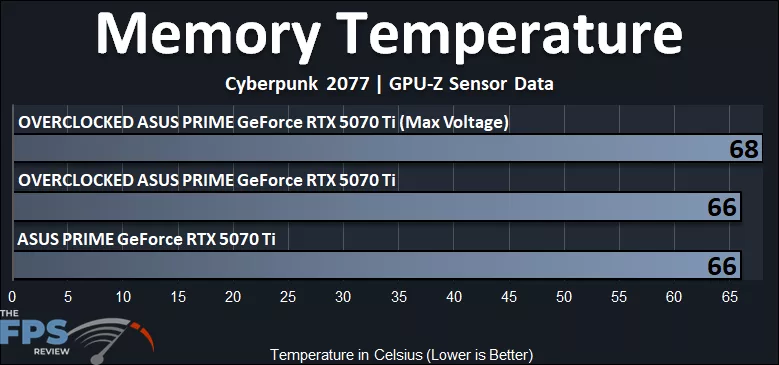
The memory VRAM temperature of the ASUS PRIME GeForce RTX 5070 Ti is also very good, at just 66c default and overclocked, and maxing out at 68c at Maximum Voltage.
GPU-Z and HWiNFO64 Screenshots
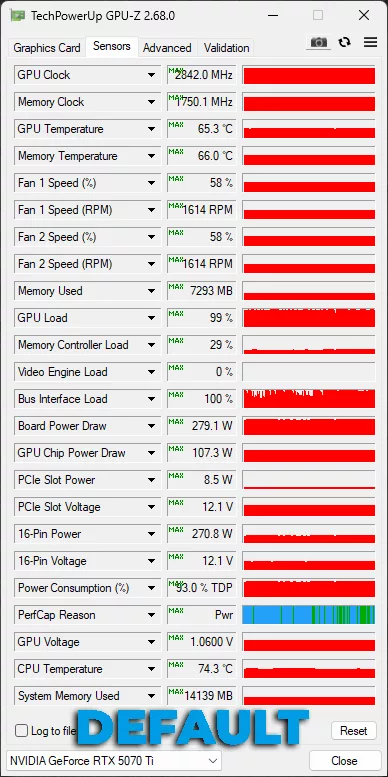
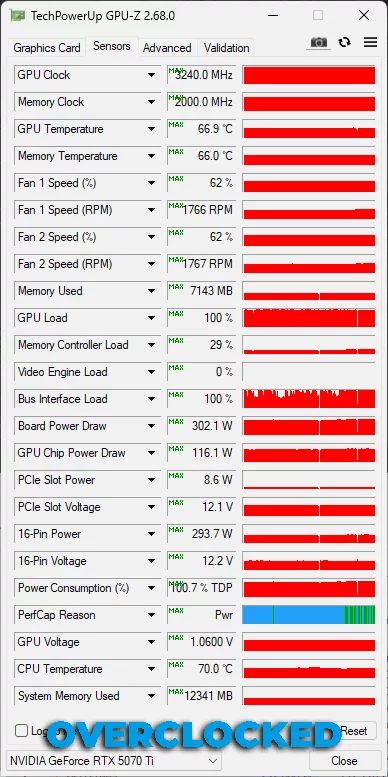
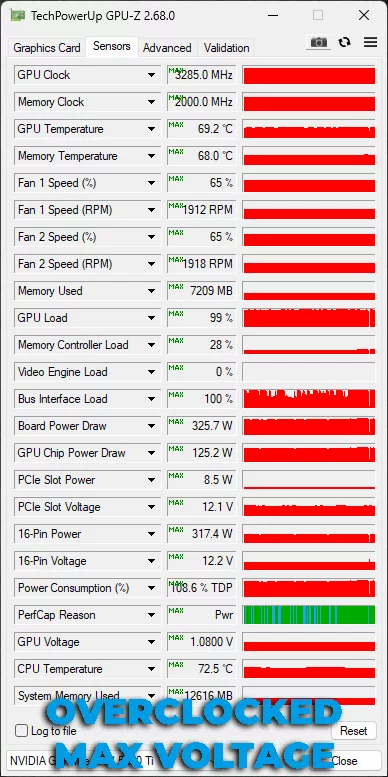
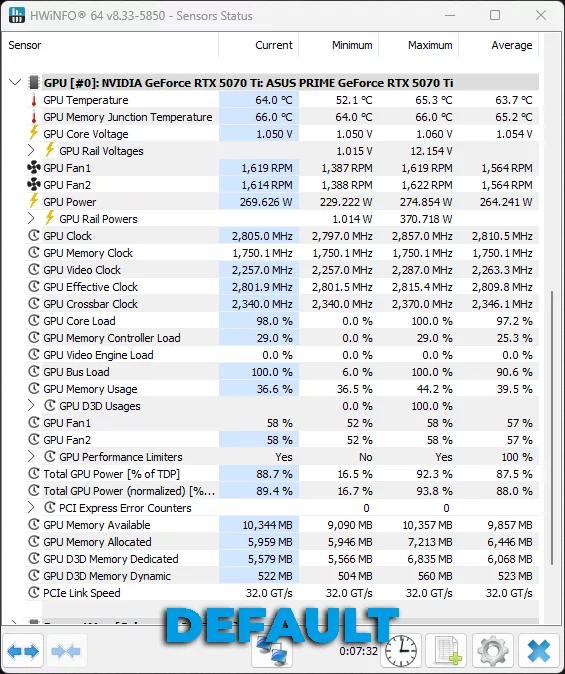
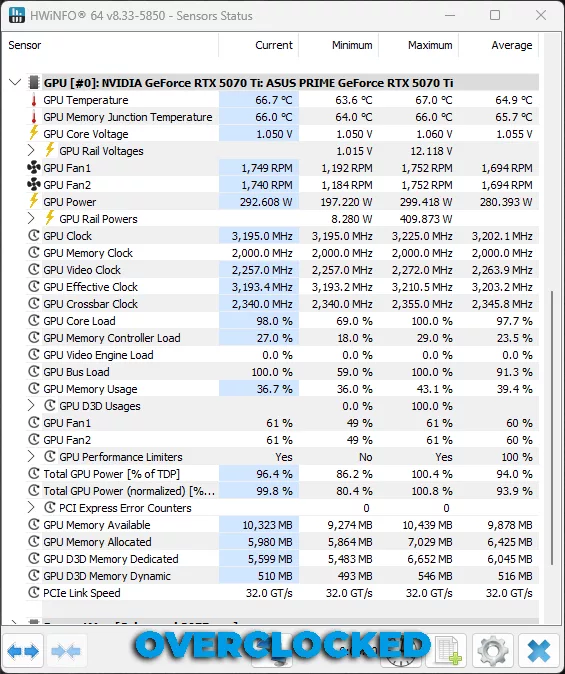
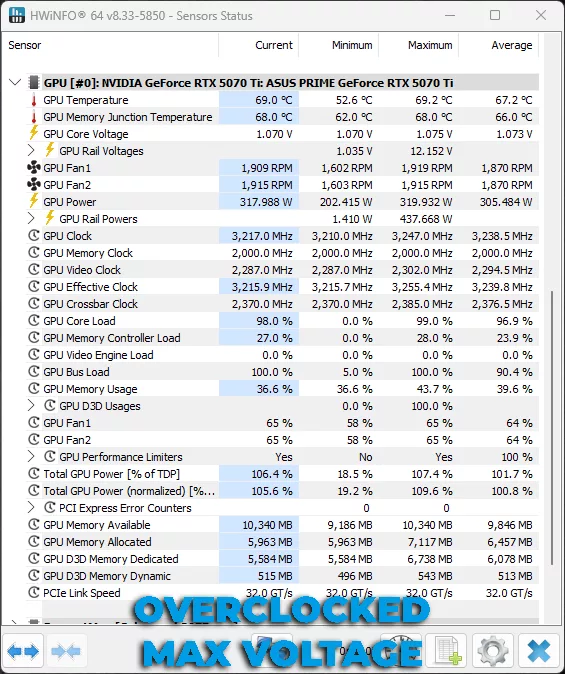
In the screenshots above, we can see that the ASUS PRIME GeForce RTX 5070 Ti runs with automatic fans at 58% on default settings at 1.0600V peak. When we overclocked the video card, without GPU Voltage, the fan speed automatically increased to 62% but the GPU Voltage remained the same. When we max out the Voltage, that increases to a peak of 1.0800V, and the fan speed automatically raises to 65% fan speed.