Motherboard Performance
In this section, you will find our standard synthetic benchmarks as well as a selection of gaming benchmarks. We initially ran our gaming benchmarks at 1080p using an NVIDIA RTX 5080 to showcase CPU performance and also to compare apples to apples as closely as possible with data forwarded to us from GIGABYTE. Benchmarks were run using the “Standard” BIOS setting first, followed by either “Maximum Performance” or “Extreme Gaming” settings in the X3D Turbo Mode 2 in the BIOS. With the exception of XMP/EXPO being enabled in the BIOS, all other settings were left to default.
The X3D Turbo Mode 2 defaults to the PBO setting of “Auto”. To finish up, we then ran the benchmarks with PBO and EXPO enabled in the BIOS with all other settings to default. Last but not least, we ran our gaming benchmarks at 4K resolution to see if X3D Turbo Mode 2 had any effect on performance at game settings more realistic to the test platform we used for this review. Our test platform included: Ryzen 9 9950X3D, Corsair Vengeance DDR5 32GB at 6000MT/s (CMH32G5M2D6000C36), MSI Spatium M580 Gen5 NVME, and NVIDIA GeForce RTX 5080 Founders Edition.
CrystalDiskMark
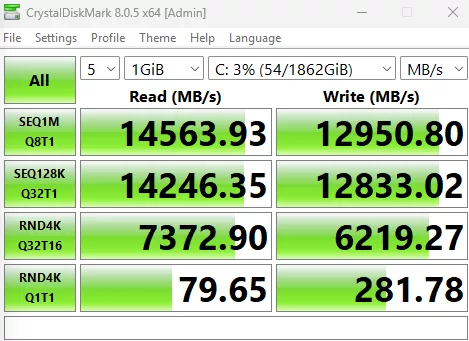
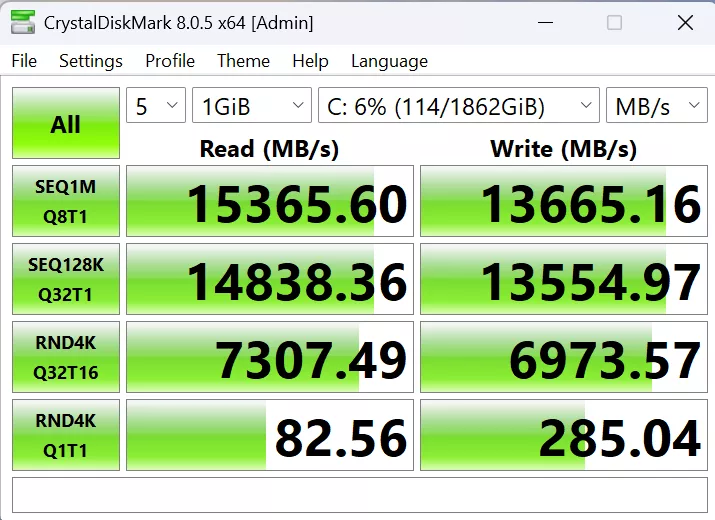
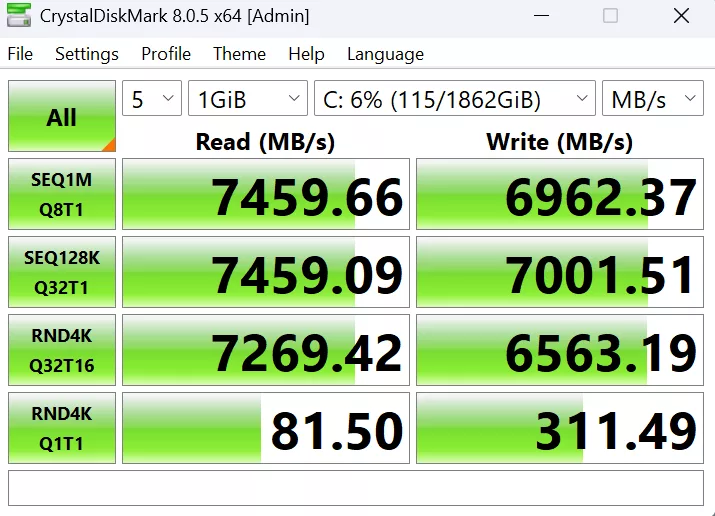
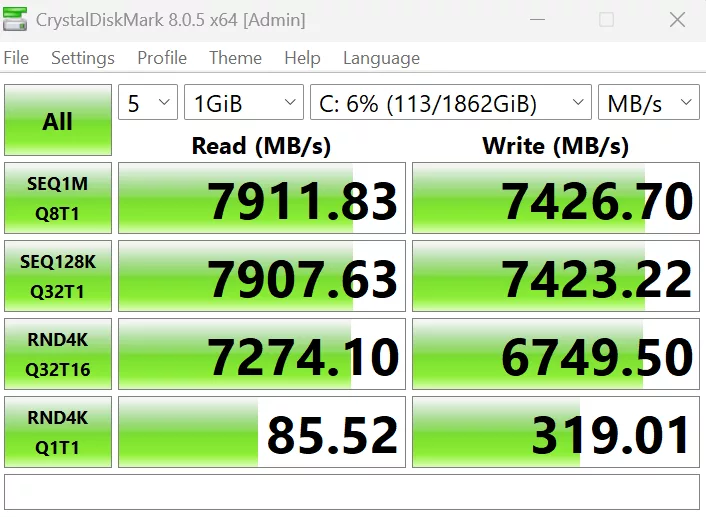
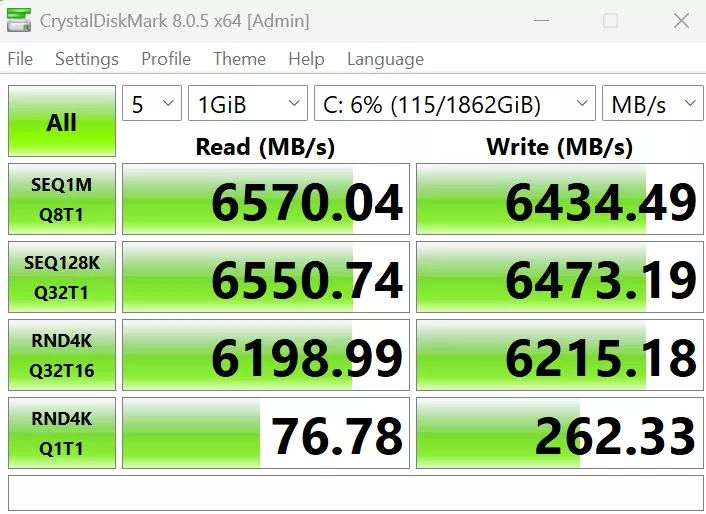
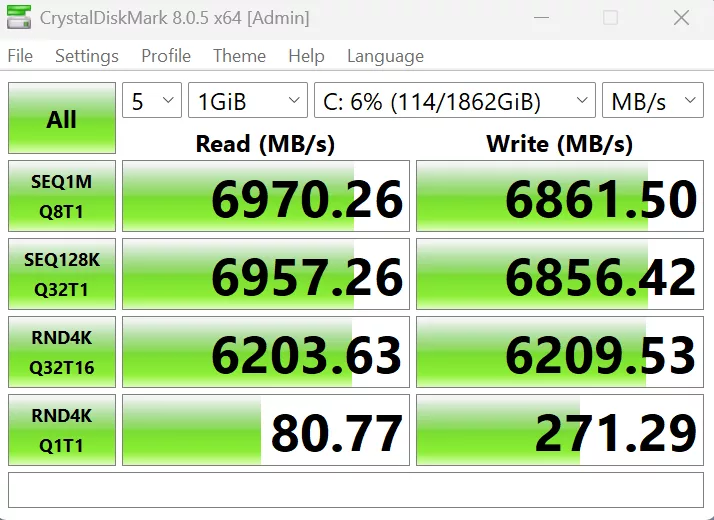
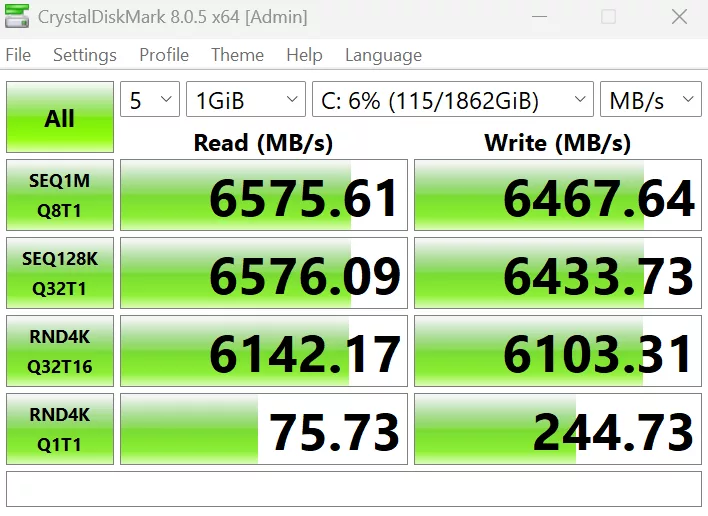
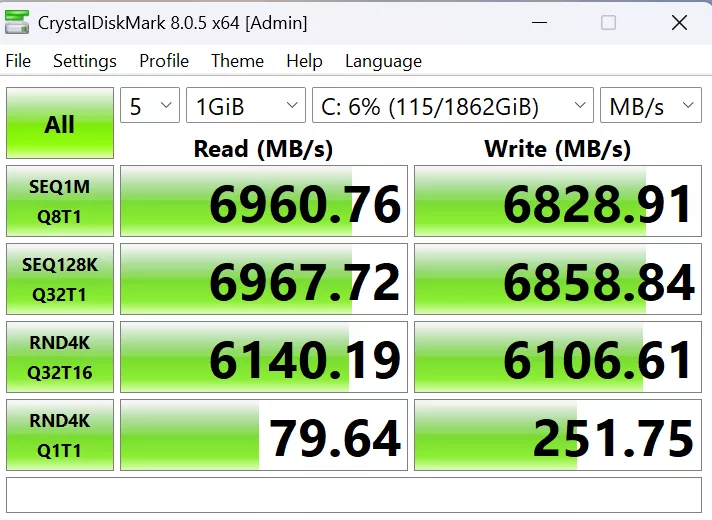
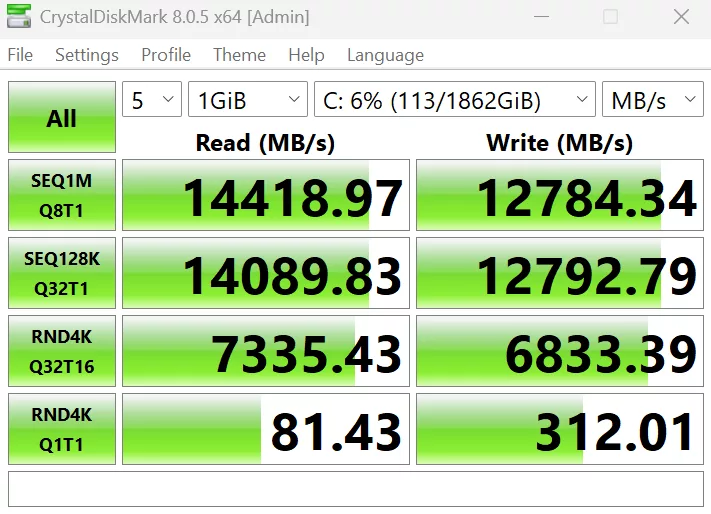
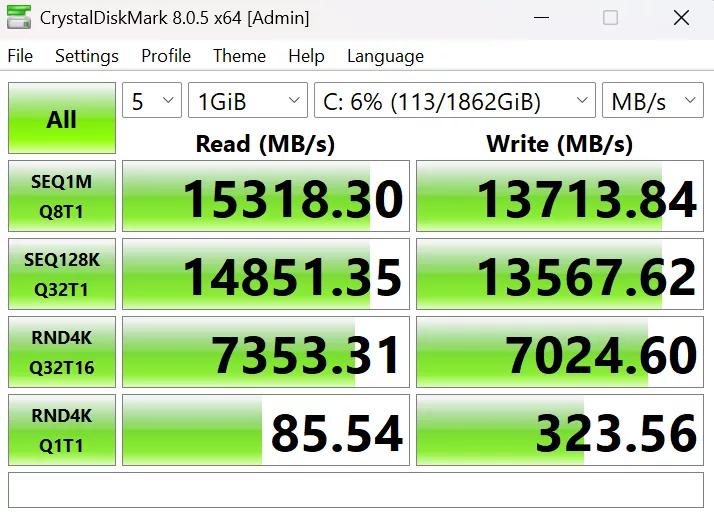
In CrystalDisk, we see typical performance by our MSI Spatium NVME. You can readily see that slot 1 is a full Gen5, as is slot 2 if switched in the BIOS (this disables the USB4 function). If left to default, it will run at Gen5 x 2. Slots 3 and 4 run at Gen4 speeds. Enabling Maximum Performance in X3D Turbo Mode 2 actually shows a 5-6% increase in read and write speeds.
AIDA 64
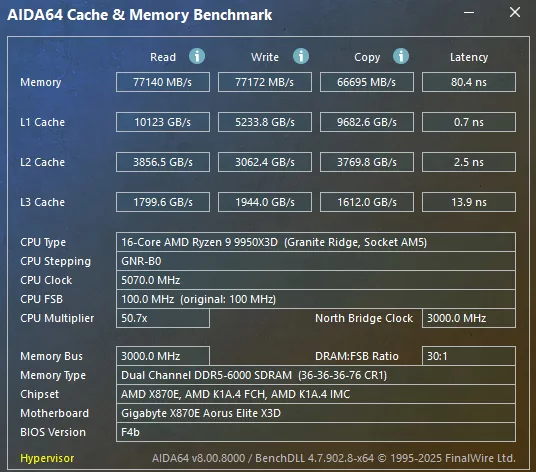
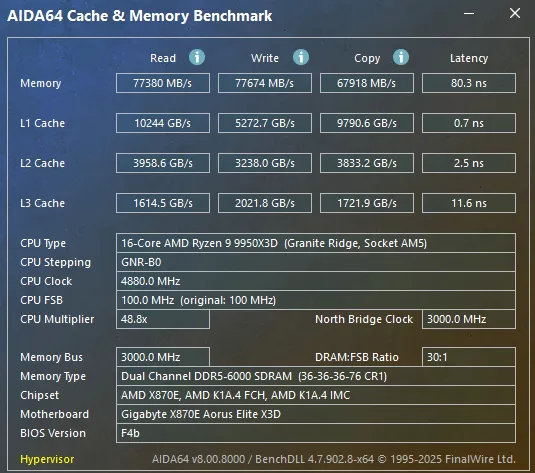
Here in AIDA64, we see memory performance that we expect from a fast CPU. There is a negligible effect from the Maximum Performance settings here, in the 2%-3% range across the board.
Cinebench R23
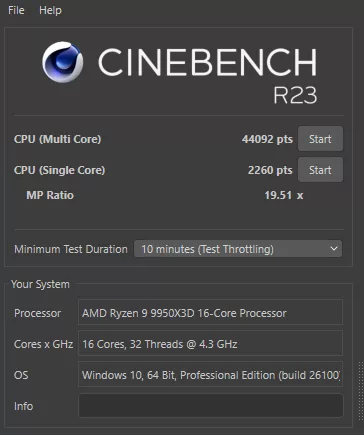
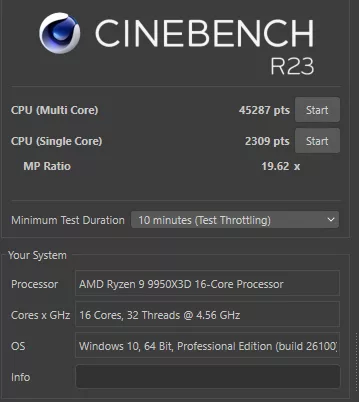
The overall performance with Cinebench is what we expect to see. There is a 2% difference in multi-core scores obtained.
Blender Benchmark
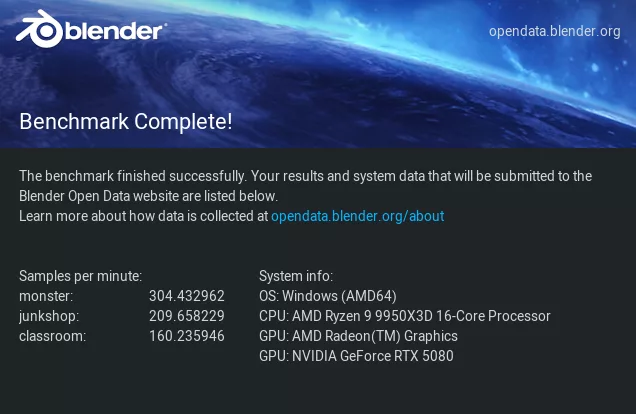
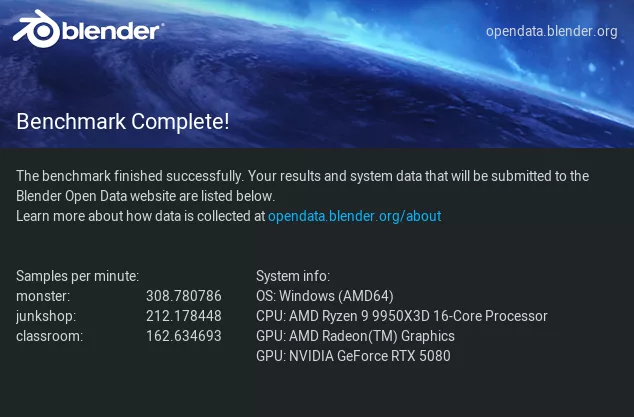
There is minimal change when comparing the two profiles in Blender. The performance otherwise is spot on for X870E motherboards.
Geekbench
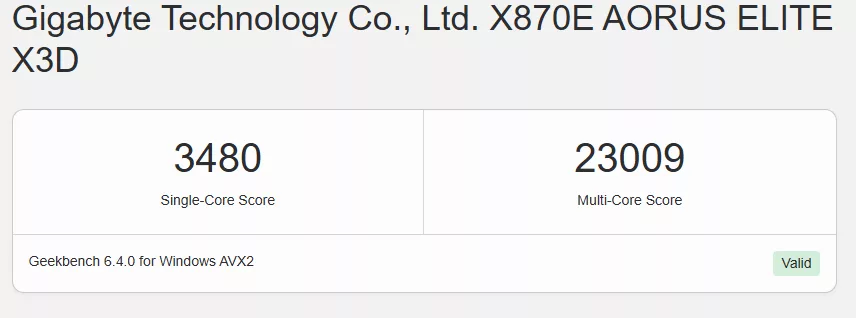
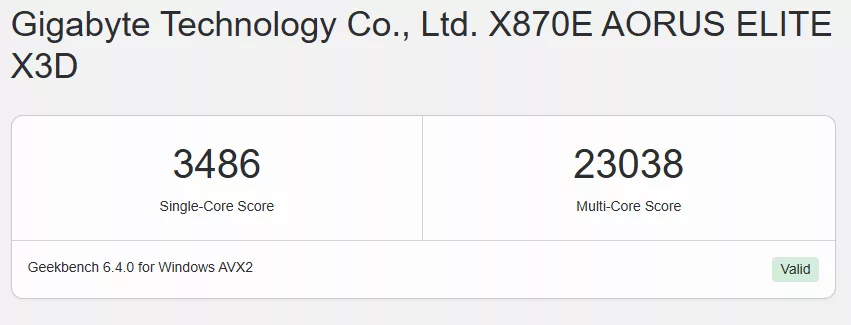
Performance is Geekbench doesn’t see much, if any, gain in enabling X3D Turbo Mode 2.
V Ray
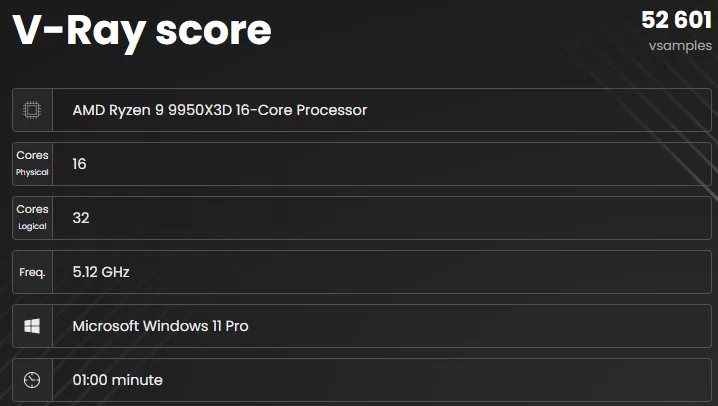
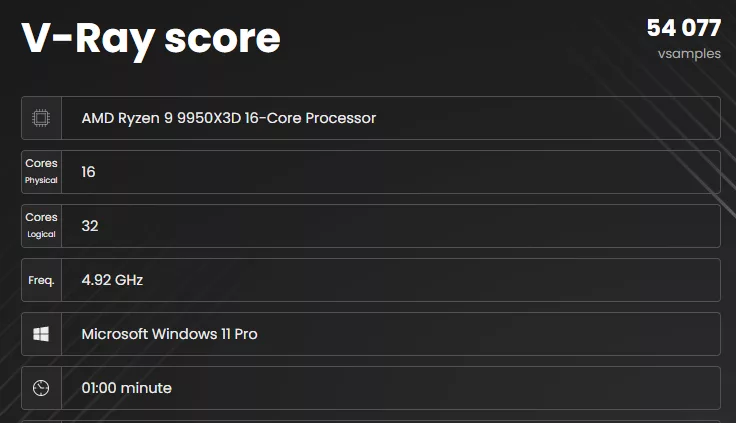
In VRay, we see a 3% gain in performance, enabling Maximum Performance.
3DMark CPU Profile
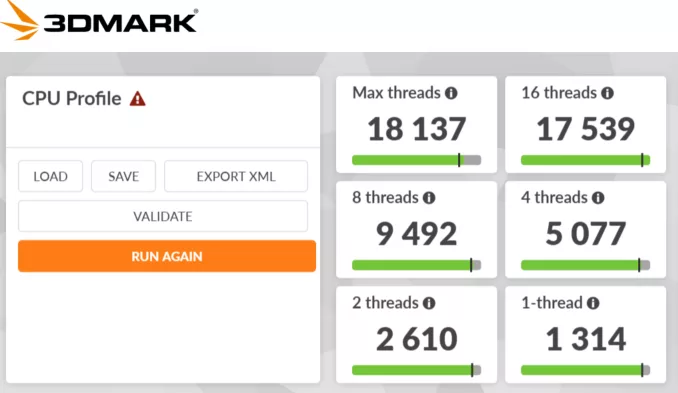
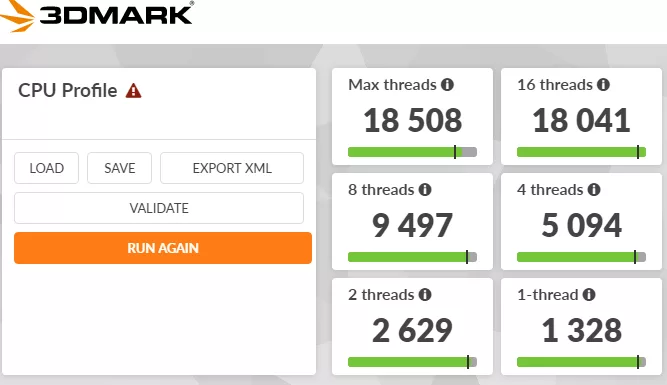
In the 3DMark CPU profile, we see a 2% difference in the Max Thread run as well as the 16 Thread run. As the number of threads tested decreases, the difference becomes quite minimal.
3DMark TimeSpy
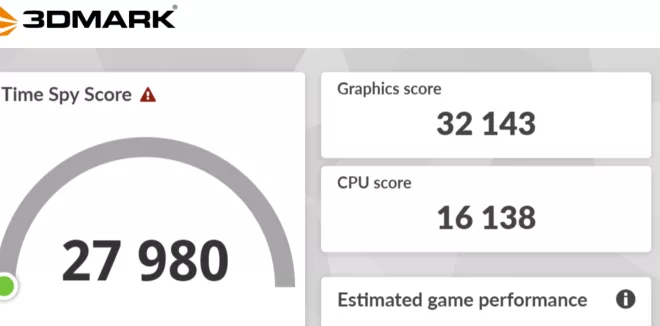
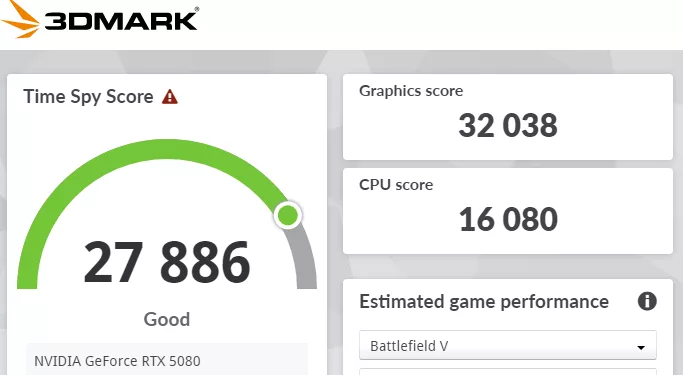
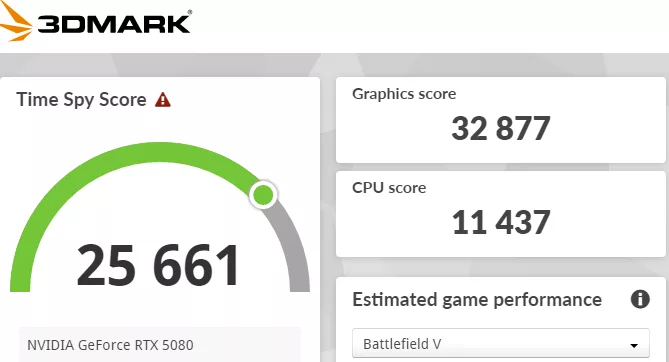
The result in 3DMark TimeSpy is a bit difficult to interpret. The CPU score is 29% lower with Extreme Gaming than with the Standard Profile. The Maximum Performance CPU result is slightly lower performing than the default BIOS settings.