Synthetic System Benchmarks
On this page, we will show synthetic benchmarks, some that test a variety of system use-case scenarios, and others that test specific multi-core and single-core/thread workloads to hone in on performance differences. Note that the graphs are arranged from fastest to slowest. We are including: AMD Ryzen 9 9950X3D, AMD Ryzen 7 9800X3D, AMD Ryzen 7 9700X, Intel Core Ultra 9 285K, Intel Core Ultra 7 265K. As you look at the AMD Ryzen 7 9850X3D, keep in mind that it is an 8-core/16-thread CPU, the same as the 9800X3D and 9700X. Therefore, the higher-core count CPUs will be naturally faster in the multi-core benchmarks.
PCMark 10 Express
PCMark 10 Express tests workloads as follows: PCMark 10 Express is a benchmark that focuses on basic work tasks. It is a good choice when tendering for PCs for general office use. The PCMark 10 Express benchmark focuses on the performance needs of a typical office worker. It tests Essentials and Productivity.
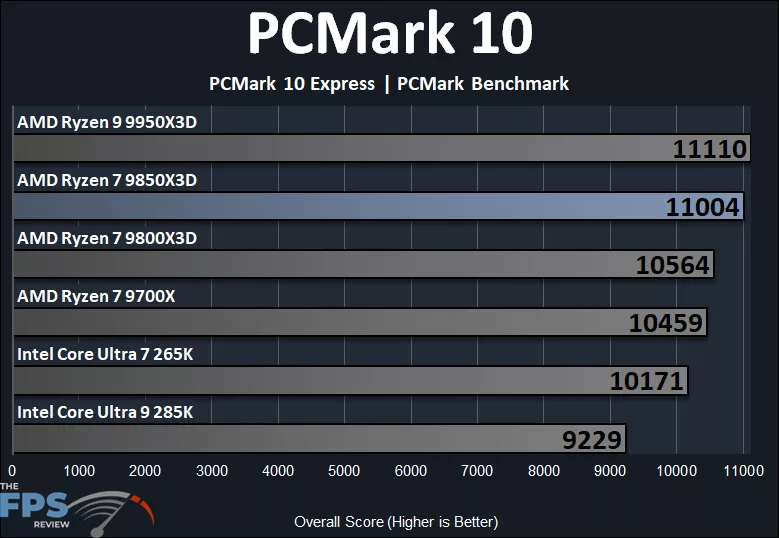
In PCMark 10 Express, which focuses more on simple workloads or single-core performance, the Ryzen 7 9850X3D scores 11,004. This puts the performance at 4% faster than the Ryzen 7 9800X3D, and 1% behind the Ryzen 9 9950X3D. The Ryzen 7 9850X3D is 5% faster than the Ryzen 7 9700X. The Ryzen 7 9850X3D is 19% faster than the Intel Core Ultra 9 285K and 8% faster than the Intel Core Ultra 7 265K. We aren’t sure why the Intel Core Ultra 7 265K outperforms the Core Ultra 9 285K in this benchmark, but since this benchmark focuses on simple single-core or thread workloads, it must be down to IPC or clock speed. More cores don’t affect this particular benchmark’s performance, but rather clock speed, latency, and cache performance.
3DMark CPU Profile
We are testing 3DMark’s CPU Profile, which tests Max Thread performance and Single Thread performance; we are reporting both on separate graphs.
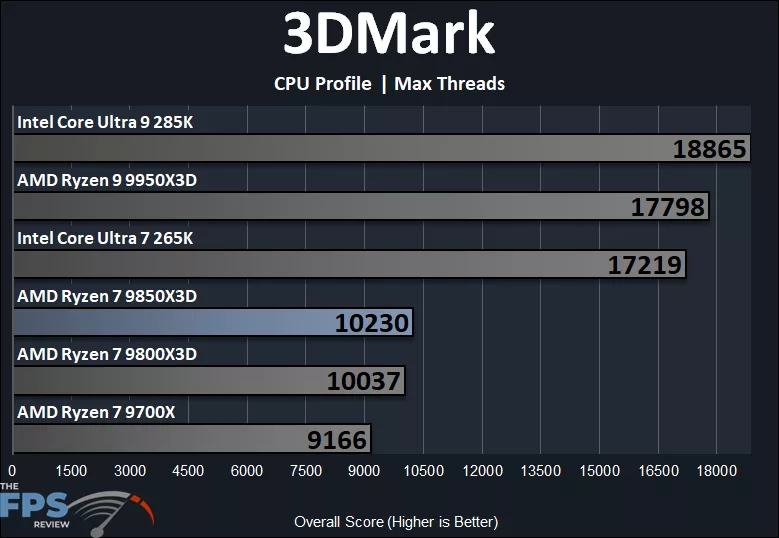
In 3DMark’s CPU Profile test, we are looking at Max Threads performance above, therefore the CPUs with more cores will naturally show much higher results. What we can see, though, is that the Ryzen 7 9850X3D does have a performance advantage over the Ryzen 7 9800X3D by 2%. It has a bigger advantage over the Ryzen 7 9700X by 12%, which is impressive for multi-thread performance on the 9850X3D.
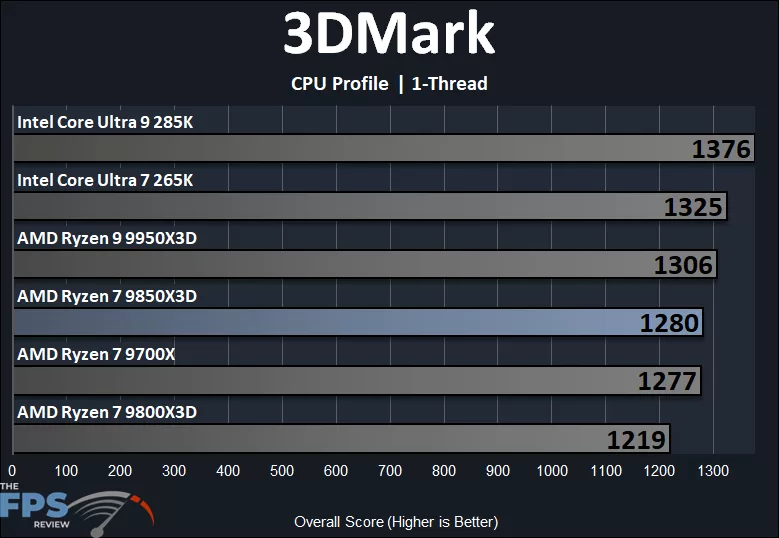
Looking at 1-thread or single-core testing, we can get a better picture of the core clock speed differences. The Ryzen 7 9850X3D is 5% faster than the Ryzen 7 9800X3D, showing that advantage. It does sit under the Ryzen 9 9950X3D, but only by 2%.
Geekbench 6
We are using Geekbench version 6.3.0 for our testing. We will show Multi-Core (nT) and Single-Core (1T) performance in separate graphs.
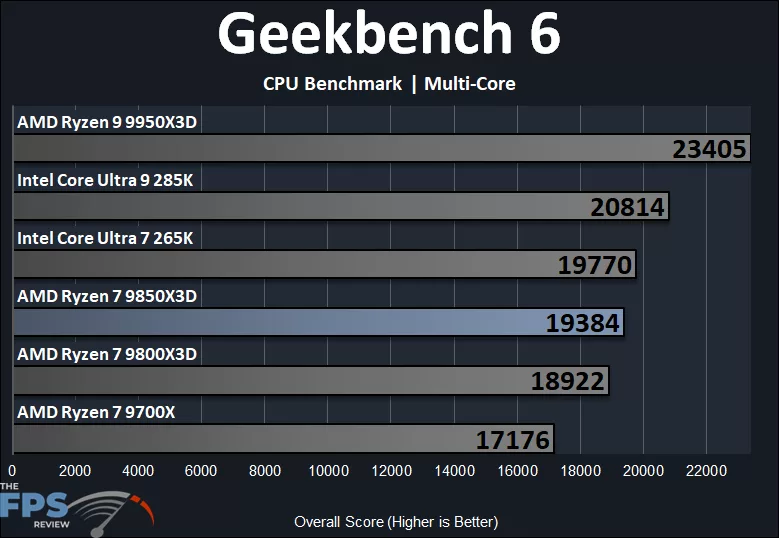
In this first Geekbench 6 test, we are showing the Multi-Core performance, so naturally, the CPUs with more cores will score higher as expected. We can see that the Ryzen 7 9850X3D is still about 2% faster in multi-core performance compared to the Ryzen 7 9800X3D. If we compare it to the Ryzen 7 9700X, however, the Ryzen 7 9850X3D is 13% faster, which is more significant.
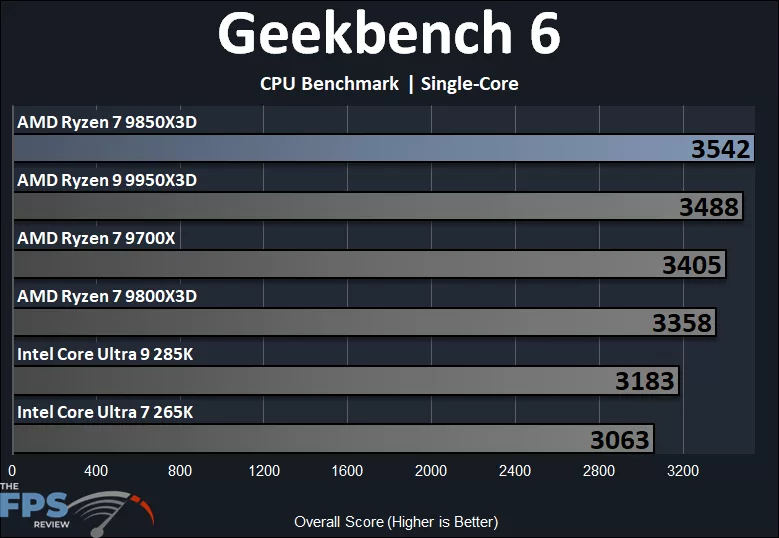
In Single-Core performance, the Ryzen 7 9850X3D rises to the top in this benchmark. The Ryzen 7 9850X3D is 5% faster than the Ryzen 7 9800X3D, matching what we saw in 3DMark. The Ryzen 7 9850X3D is also 2% faster than the Ryzen 9 9950X3D in this benchmark, and 4% faster than the Ryzen 7 9700X. The Ryzen 7 9850X3D is also significantly faster than the Intel Core Ultra 9 285K by 11% and the 265K by 16%.
PassMark PerformanceTEST
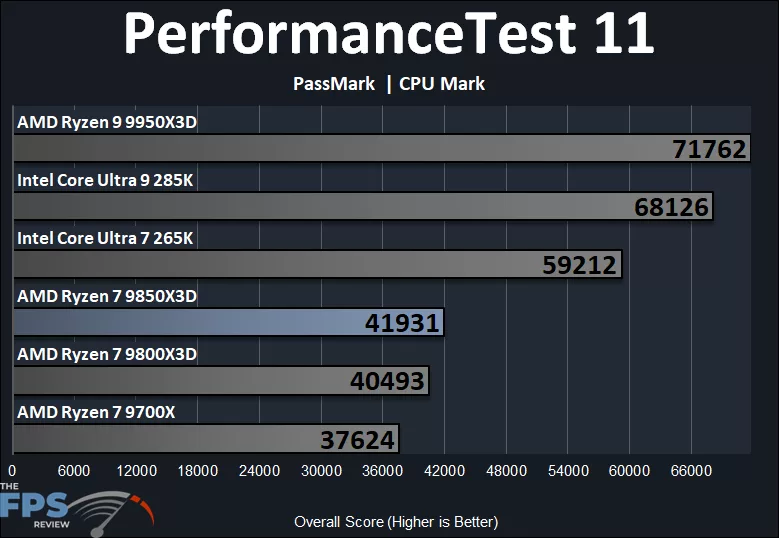
PerformanceTest 11 PassMark CPU Mark tests the CPU’s overall performance, but core count does affect the results. The Ryzen 7 9850X3D is 4% faster than the Ryzen 7 9800X3D, and 11% faster than the Ryzen 7 9700X.