
Gaming Performance Continued
Dying Light: The Beast
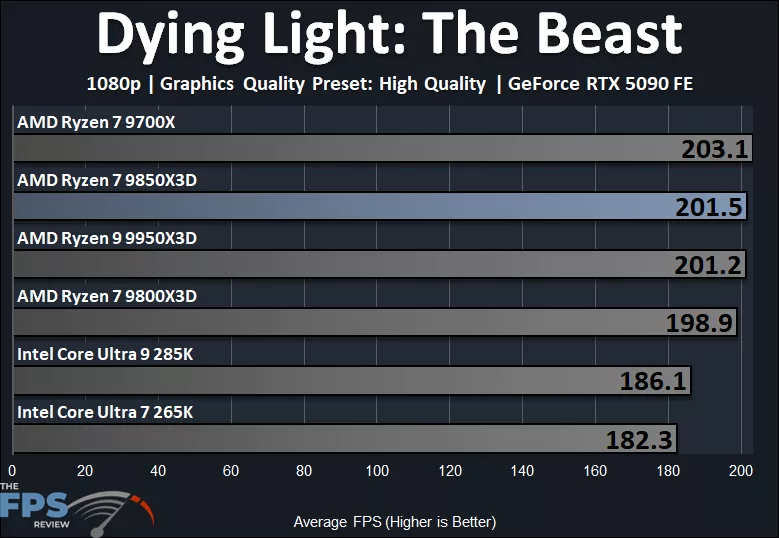
Dying Light: The Beast is a new game we have been adding to benchmarks, and it has recently received some big patches that give it Ray Tracing support. For our testing, we are just running the “High Quality” preset, which does not enable Ray Tracing, and we are using a long manual run-through. We have found this game to be very GPU-dependent.
Oddly, this is the only game where the Ryzen 7 9700X came out on top in performance. We thought this was weird, so we reinstalled the 9700X and the 9850X3D, and verified results, and that is what we saw. Maybe it’s a clock speed thing? Maybe it’s a cache or latency thing? Whatever the case, this game prefers the Ryzen 7 9700X, but it is the only game in our testing that did this. We would like to further test this, perhaps at lower game settings or with Ray Tracing, to see what happens.
Regardless, the Ryzen 7 9850X3D is a top performer, but still only minor when compared to the Ryzen 7 9800X3D. The Ryzen 7 9850X3D is 1% faster than the Ryzen 7 9800X3D, a common theme we are finding. Performance is identical to the Ryzen 9 9950X3D. Intel is once again lagging far behind. The Ryzen 7 9850X3D is 8% faster than the Intel Core Ultra 9 285K and 11% faster than the Intel Core Ultra 7 265K.
Hogwarts Legacy
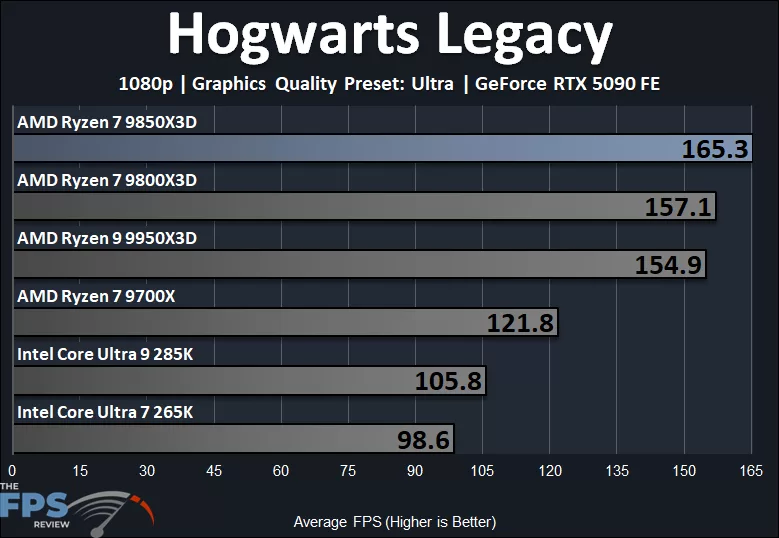
The section we used in Hogwarts Legacy for testing, in the Hogsmead area, has always proven to be an excellent test of CPU-bound performance. The Ryzen 7 9850X3D tops the charts on performance, and well Intel gets absolutely destroyed in this game. The Ryzen 7 9850X3D is 5% faster than the Ryzen 7 9800X3D and 7% faster than the Ryzen 9 9950X3D. This game loves 3D V-Cache, and thus the Ryzen 7 9850X3D is 36% faster than the Ryzen 7 9700X! But if you really want to see a blow, then look no further, the Ryzen 7 9850X3D is 56% faster than the Intel Core Ultra 9 285K and 68% faster than the Intel Core Ultra 265K!
Horizon Forbidden West
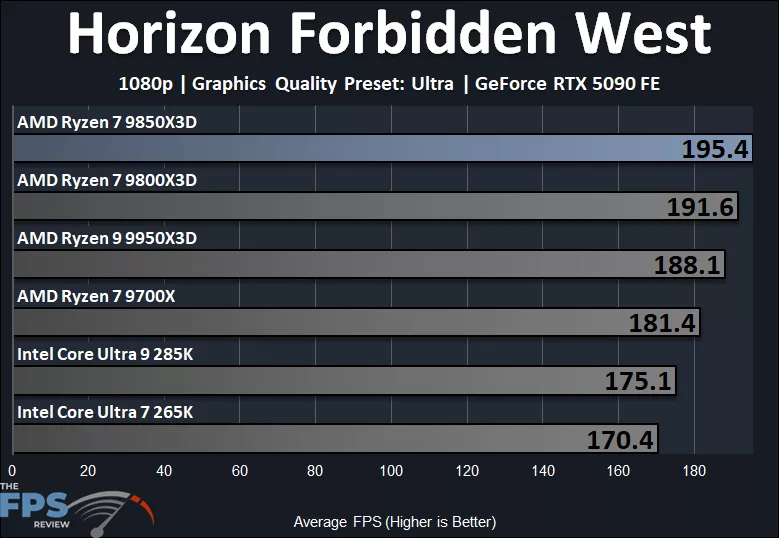
In Horizon Forbidden West, the Ryzen 7 9850X3D is the fastest CPU yet again, topping the charts. The Ryzen 7 9850X3D is 2% faster than the Ryzen 7 9800X3D and 4% faster than the Ryzen 9 9950X3D. The Ryzen 7 9850X3D is 8% faster than the Ryzen 7 9700X. The Ryzen 7 9850X3D is 12% faster than the Core Ultra 9 285K and 15% faster than the 265K.
Mafia: The Old Country
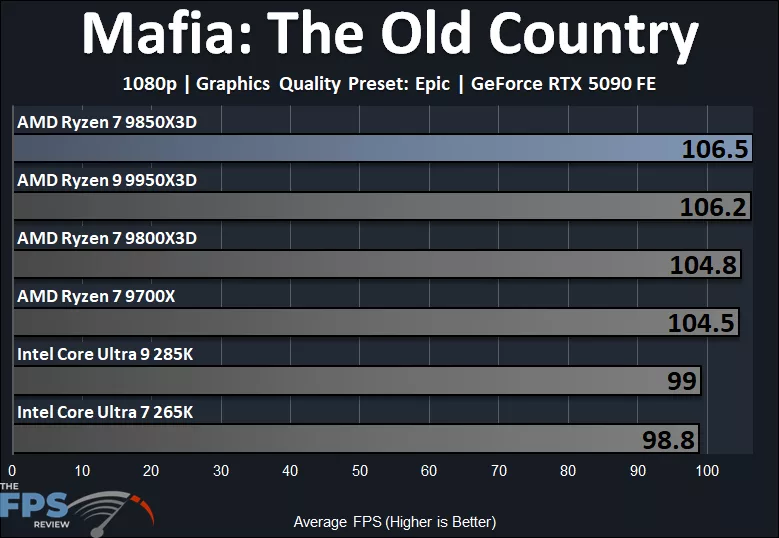
Mafia: The Old Country is another new game we have been testing. This game is also very GPU-dependent, and we are running it at the “Epic” quality setting, which is GPU-heavy, as you can see. We are running at 1080p, but even that only gives us around 100FPS. Still, the Ryzen 7 9850X3D is able to provide the highest performance, matching the Ryzen 9 9950X3D. The Ryzen 7 9850X3D is 2% faster than the Ryzen 7 9800X3D and the Ryzen 7 9700X. Either this game doesn’t benefit well from 3D V-Cache, or it is not very CPU-dependent even with the RTX 5090. The Ryzen 7 9850X3D is 8% faster than the 285K and 265K.
S.T.A.L.K.E.R. 2: Heart of Chornobyl
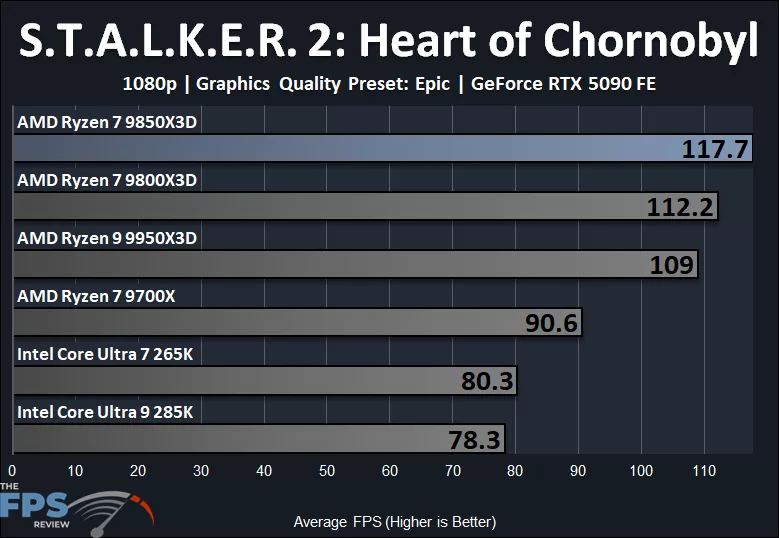
S.T.A.L.K.E.R. 2: Heart of Chornobyl has always proven to be a great game to use for CPU testing, as it is CPU-dependent, especially in towns and around NPCs. This game shows off the CPU performance differences very well. The Ryzen 7 9850X3D sits at the top and is 5% faster than the Ryzen 7 9800X3D and 8% faster than the Ryzen 9 9950X3D. Compared to the Ryzen 7 9700X, the Ryzen 7 9850X3D is 30% faster, showing the great advantage of that 3D V-Cache. Intel gets destroyed in this game. The Ryzen 7 9850X3D is 50% faster than the 285K and 47% faster than the 265K.
Discussion (19 replies)
Join Discussion →That is an impressive 8 core single CCD CPU. Very nice...
Would be neat to see what a single CCD 12 core 3dvcache CPU would be awesome. :)
Exactly what we expected.
This is the only review showing less power use vs the 9800x3d, all other tests show the 9850x3d consuming more power.
[embedded media]
Brent can probably speak to this better, but there's a ton of variables that go into power consumption - including the game, the game resolution and game settings that are selected for testing. We don't typically do far ranging power analysis - Toms, for example, seems to be running all their standard tests through benchlab which makes it easy to pull together a ton of power graphs that correlate to the benchmarks run. Our power testing tends to focus on games.
There can also be differences in where the power is measured - benchlab (which they used on the power testing page) is an external to the system pass through that doesn't directly measure CPU usage, whereas we're pulling our power measurements from HWiNFO64. Though, really, I can't tell what method they used to measure CPU power usage in their gaming benchmarks as it's not disclosed....
As stated in the review: "
As stated in the review: "On this page, we are going to test the power draw on the CPUs, testing multi-core performance in Cinbench 2026 running for 15 minutes."
The method I used (and always have used) is a simple Cinebench Multi-Core, full-load, power test. I run Cinebench on the multi-core benchmark for at least 15 minutes, looping. I have HWiNFO up on the screen, and monitor the "Package Power" reported. I then graph the maximum or peak power number represented.
I do not claim that this is a thorough or detailed power test. It is meant to verify or validate all-core power loads and report on the quoted or rated TDP from AMD and Intel. I am aware that TDP is the thermal design power recommendation for cooling.
I do claim this is a valid measurement, and a real-world use-case scenerio that an end user would realistically encounter in real-world usage. For example, if you are editing and encoding or transcoding video in a video editor, or running 3D renders, or anything that pushes all cores to the max, this is the power you would experience in a real-world use case.
This is different than testing power while gaming. This is not showing power while gaming. I have done that in the past, on certain CPUs, but this was not that. You will note that Tom's testing was in games, which has a very different load than what I was doing. I was using productivity-based testing.
In addition, I am aware there are more accurate ways to capture power usage, but our reviews don't focus on that aspect. This method shows the 'cap' that the motherboard BIOS sets for package power. We can see that power is above the "TDP" number they provide, and we can see where it caps out with this method. I encourage you to look at other reviews for more detailed power testing and analysis.
I hope that helps.
One thing I'll also add to my statement: Testing power while gaming will be very different from all-core full-load testing because, while gaming, the CPU cores will boost to higher frequencies and voltages, since less of them are being used, and the workloads are lighter. Therefore, the peak power registered on such things as the EPS rails will be higher and peak higher than pushing all-cores to full-load at the same time. When doing that, the clock frequency and voltages are lower, and thus it peaks lower overall.
That makes sense to me. You're not investing in power measurement devices like what others are doing as that is not your intended level of testing. This is more a user experience and repeatable test than say a specialized break down. Its clear tne texhnical chops are here and are in essence providing the tools and guidance to replicate local testing by us more... savvy I dare say... readers. Letting us more easily identify anomalous behaviors.that may or may not exist. (Looks cautiously at ASROCK motherboards.)
Nice CPU for sure but I'll be waiting for one (either the 9950X3D2) or something else down the road to replace the 5800X3D in my spare rig and the main one with a 9800X3D is plenty for now.
As always, thanks for the review!
why all the hoopla on a CPU that's not worth buying?
It's only a little bit faster than the 9800X3d, but is more expensive, draws more power and generates more heat.
I don't see any scenario where getting a 9850X3D over a 9800X3d makes sense.
The folks who have to have "the best"
Someone who just now is coming into tax money to build a new box and leave their 3000 series behind?
Should depend on pricing and availability more than anything. My guess is that we'll see the 9800X3D chips start drying up leaving the 9850X3D as the only choice and/or the price point will be so close that the extra $10-20 might as well be spent.
My original theory is the 9800X3D will go away and be replaced by a lower binned 9700X3D to provide some separation, but AMD has stated the 9800X3D production will continue (of course, that may mean just for one day....)
I've seen this suggested by others. I think they have contacts too. Starting to think this is a leak. :p
If the rumors of the 9700X3D are true, that's one more kick to Arrow Lake. The 265K will lose its appeal quickly since the 9800X3D's $449 price was making it turn up in the shopping cart of some people. Now people like that could opt for the 9700X3D if they can get it at something like $389.
Using canadian pricing as an example, I don't see an imaginary CPU causing any issues for intel.
265KF is $399
9700x is $460
7800X3D is $550
14900K is $620
9800X3D is $640
9850X3D is $720
285K is $780
Intel is the value leader right now. Given the price of ram. A full $240 difference between a 265k and 9800x3d. I won't even talk about the 9850x3d because the pricing makes zero sense. $80 more Cad$ is just terrible.