Synthetic System Benchmarks
On this page, we will show synthetic benchmarks, some that test a variety of system use-case scenarios, and others that test specific multi-core and single-core/thread workloads to hone in on performance differences. In all of our graphs to follow, the bars are arranged from the fastest MT/s speed down, so 8800MT/s is on top, with 6400MT/s on the bottom, and this arrangement is locked in independent of the performance shown; they are not arranged by result, but rather the DDR5 memory speed.
AIDA64
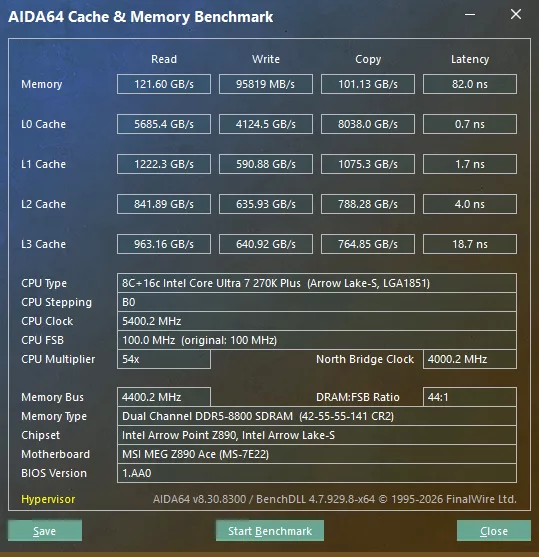
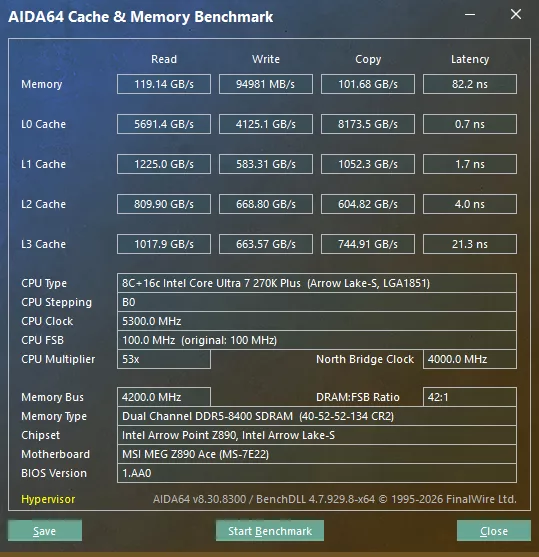
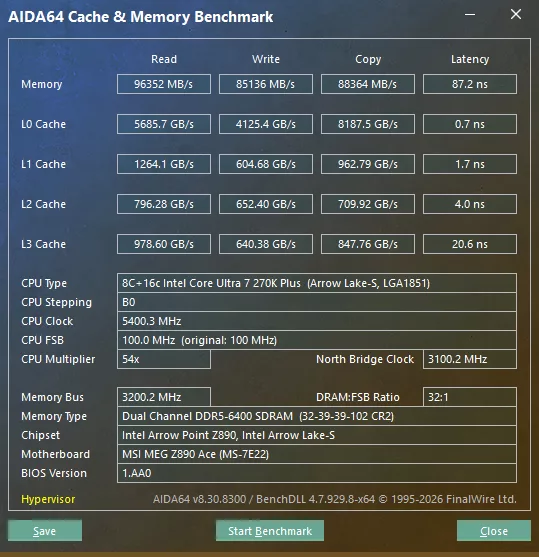

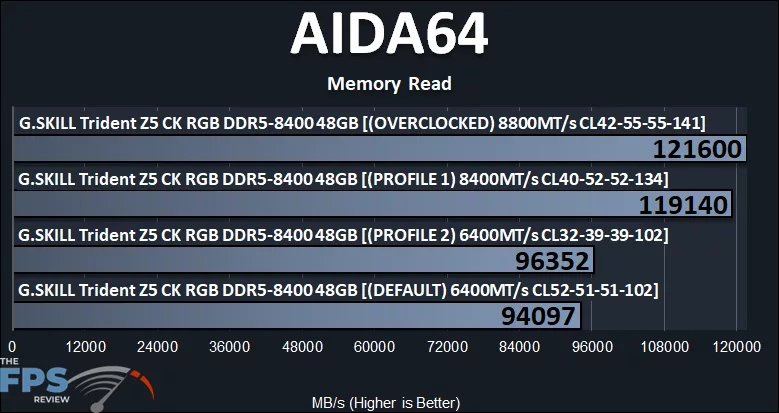
In AIDA64’s memory read performance, at the default 6400MT/s, we get about 94GB/s of memory bandwidth. Just utilizing Profile 2 at the tighter timings at 6400MT/s increases that to 96GB/s, or 2% more bandwidth. However, we get a much larger increase in the course when we increase the frequency. Running at the XMP Profile 1 this memory is meant for at 8400MT/s bandwidth jumps to 119GB/s, an increase over the default of 27% more bandwidth. Upping that to 8800MT/s increases it by another 2%.
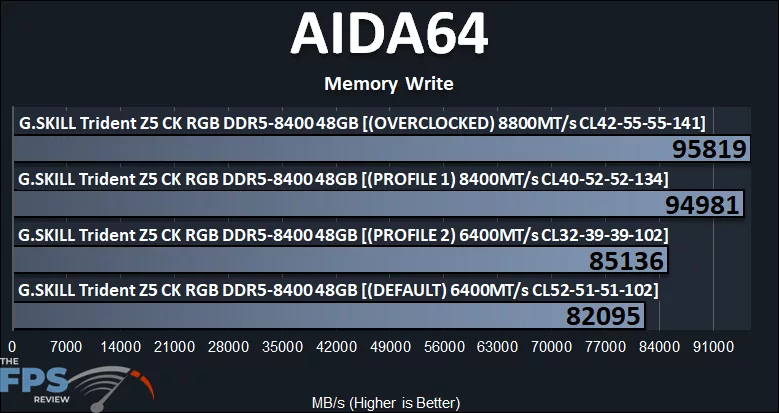
In AIDA64’s memory write performance, we also see some notable gains, though less than the read performance gains. Simply by moving to XMP Profile 2, the write performance increases by 4%. The largest gains, though, are once we move up to the XMP Profile 1 at 8400MT/s, which is 16% more bandwidth than the default SPD setting. Moving up to 8800MT/s only improves by a slight 1% over that.
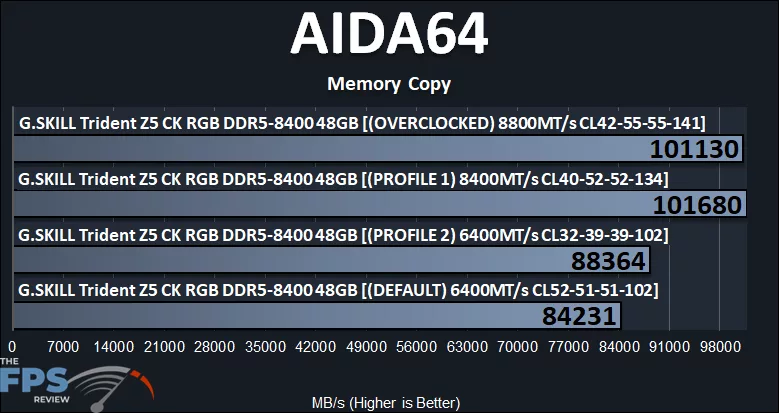
Memory copy performance is also greatly affected by the increase in memory performance. Moving up to Profile 2 alone improves upon the default by 5%. When we move up to XMP Profile 1, at 8400MT/s bandwidth goes up 21% over the default. Moving up to looser timings at 8800MT/s actually has a slight regression, so the faster timings at 8400MT/s is actually slightly faster.
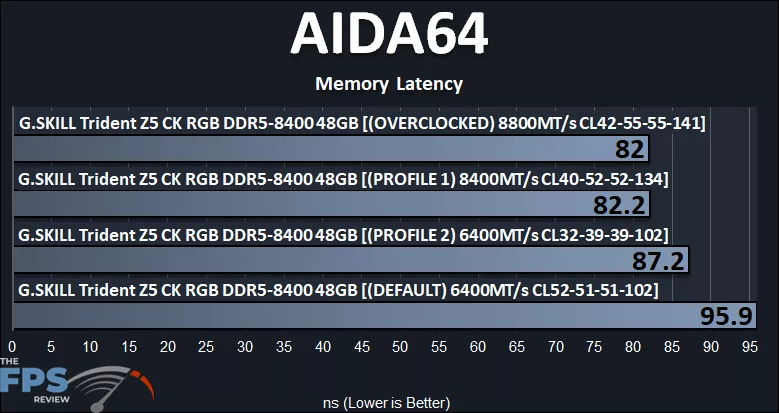
Latency is also something that improves as we go up in performance. At default, it’s as high as 95.9ns, but setting XMP Profile 2 with the better timings decreases that to 87.2ns. At XMP Profile 1 it is down to 82.2ns, and 8800MT/s is about the same.
3DMark CPU Profile
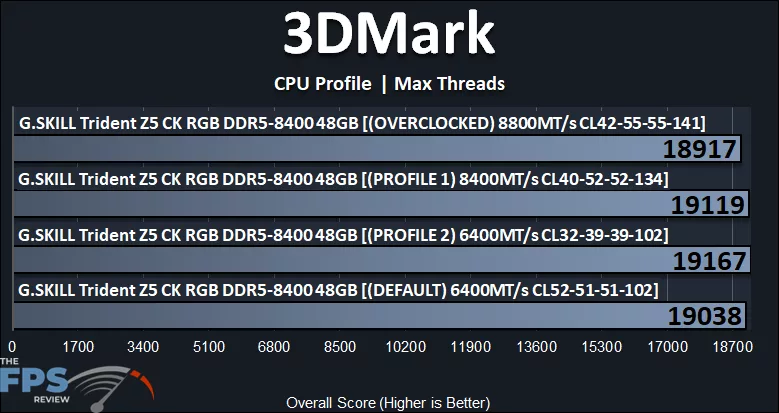
In 3DMark’s CPU Profile test, we are testing the Max Threads CPU performance, which is very slightly affected by the memory performance. There is a benchmarked improvement in the result at XMP Profile 2 and XMP Profile 1 over the default. It is only half a percentage at best, but it is there slightly. There is a regression at 8800MT/s, which actually drops below the default performance.
Geekbench 6.7
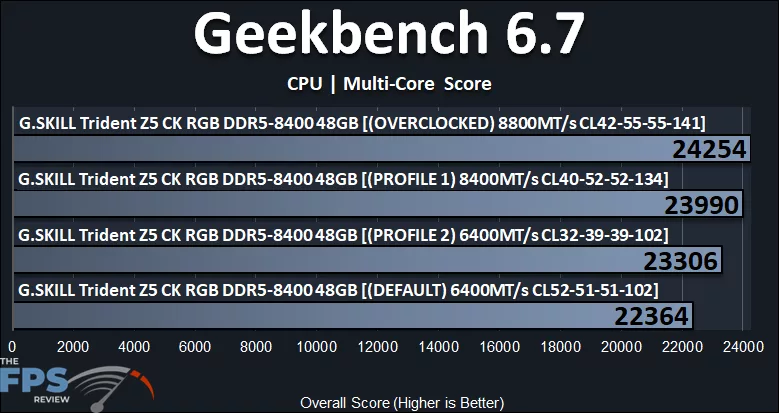
In Geekbench, though, we see a much different result with clear advantages due to higher memory performance. In Geekbench, it tests several different types of workloads on the CPU, rather than 3DMark, which is one synthetic workload type to test theoretical CPU performance. In Geekbench, moving up to XMP Profile 2 gives us a 4% performance uplift. However, enabling XMP Profile 1 at 8400MT/s boosts performance by 7% over the default. Moving up to 8800MT/s improves that by another 1%.
PassMark PerformanceTEST
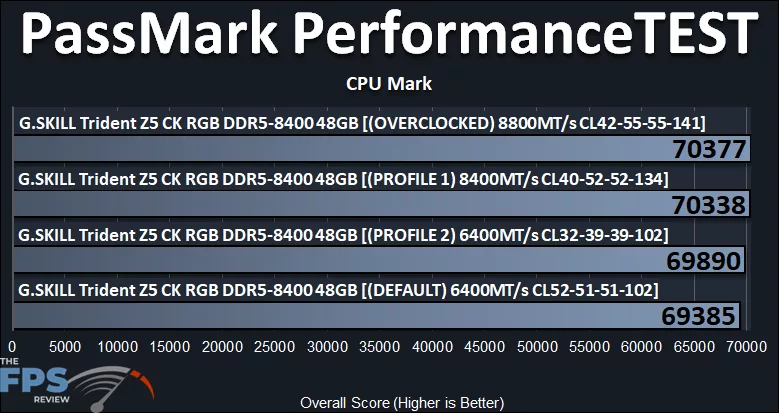
In PassMark PerformanceTEST, there is technically a difference between the memory performance, but it is minor in this benchmark. Using the XMP Profile 1 at 8400MT/s is about a 1.3% performance uplift compared to the default. Overclocking to 8800MT/s is very minor.