CompuBench
CompuBench is a suite of specific Compute based performance tests. We utilized the CUDA rendering API for these tests. Make sure to scroll down to the bottom, there are 11 graphs on this page.

In the Level-set Simulation 128 test GeForce RTX 3080 Founders Edition is much faster than all the cards here. It is 71% faster than the GeForce RTX 2080 FE and 32% faster than the GeForce RTX 2080 Ti FE.
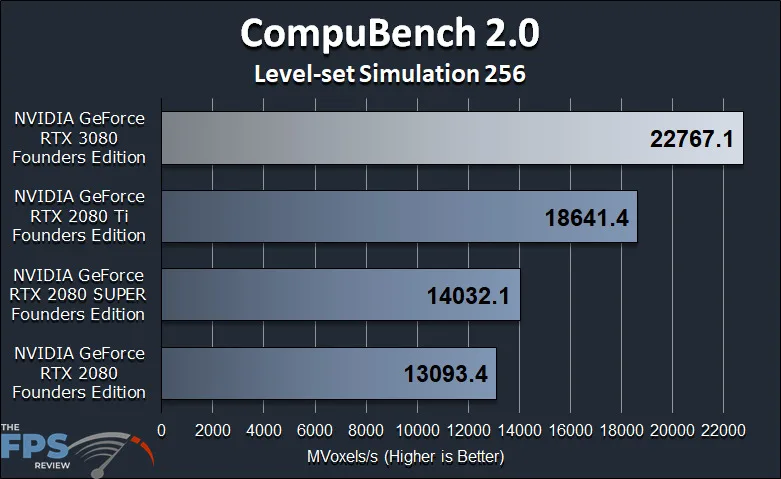
In the Level-set Simulation 256 test, the GeForce RTX 3080 FE is 74% faster than the GeForce RTX 2080 FE and 22% faster than the GeForce RTX 2080 Ti FE.
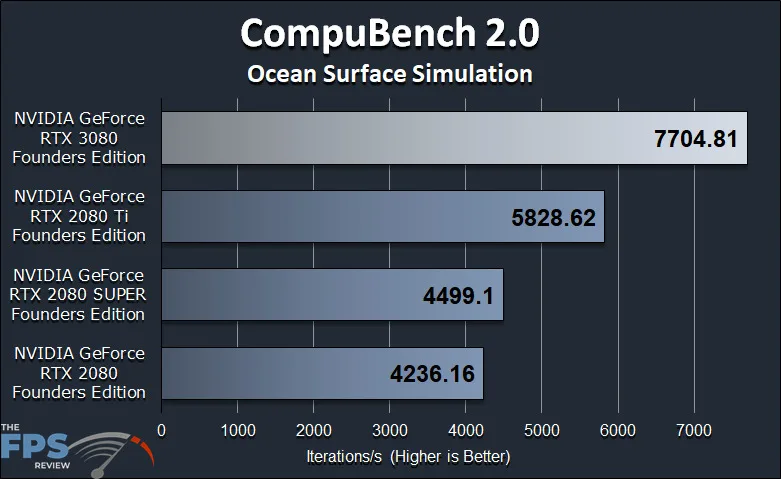
The Ocean Surface Simulation test also shows high performance on the GeForce RTX 3080 FE. It’s 82% faster than the GeForce RTX 2080 FE and 32% faster than the GeForce RTX 2080 Ti FE.
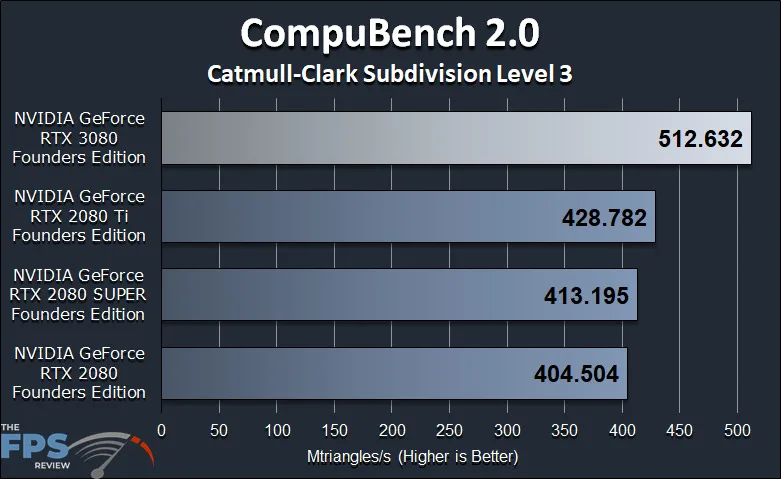
Catmull-Clark Subdivision Level 3 on the GeForce RTX 3080 FE is 27% faster than the GeForce RTX 2080 FE and 20% faster than the GeForce RTX 2080 Ti FE.
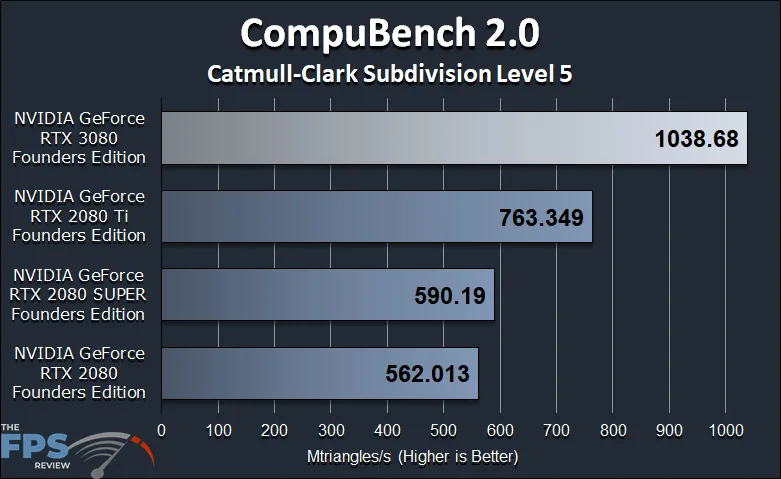
Catmull-Clark Subdivision Level 5 on the RTX 3080 FE is 85% faster than the GeForce RTX 2080 FE and 36% faster than the GeForce RTX 2080 Ti FE.
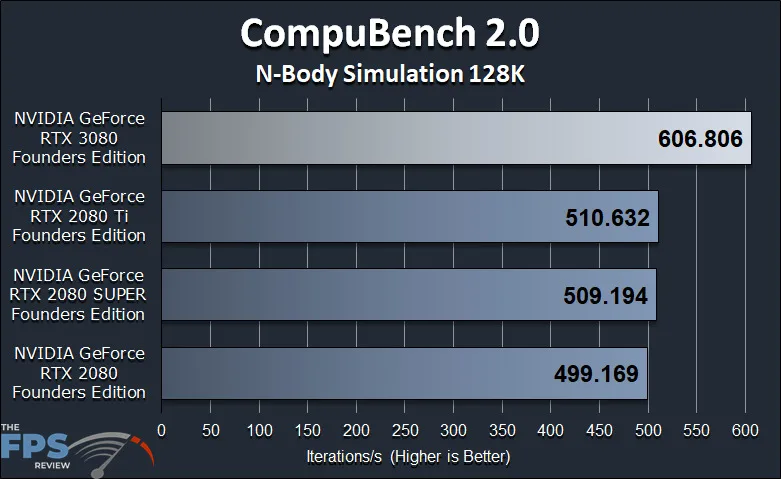
N-Body Simulation 128K on the GeForce RTX 3080 FE is 21% faster than the RTX 2080 FE and 19% faster than the RTX 2080 Ti FE.
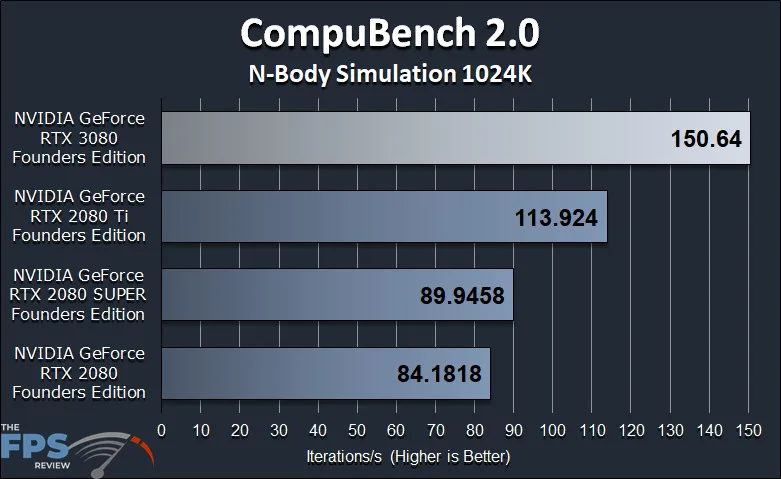
N-Body Simulation 1024K on the RTX 3080 FE is 79% faster than the GeForce RTX 2080 FE and 33% faster than the RTX 2080 Ti FE.
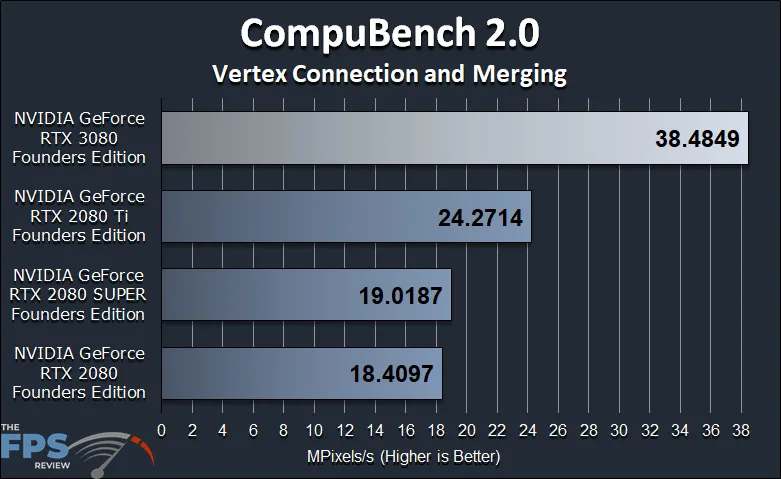
Vertex Connection and Merging is a lot faster on RTX 3080 FE at 111%, more than double, the RTX 2080 FE. It’s 58% faster than the RTX 2080 Ti FE.
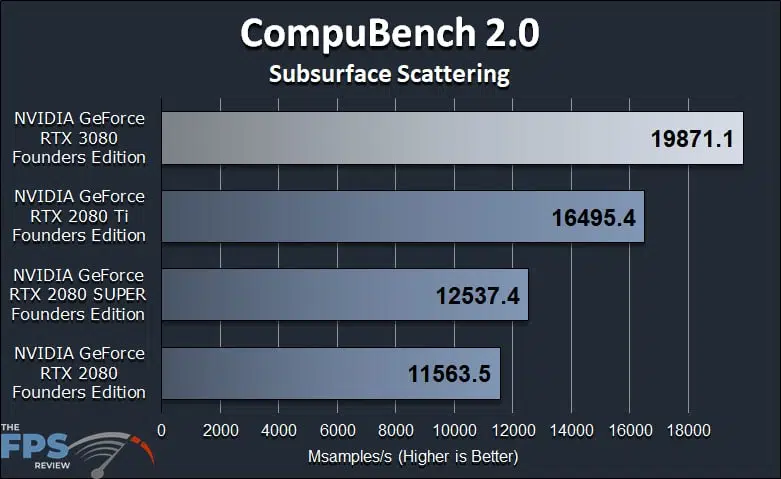
Subsurface Scattering is 72% faster on the RTX 3080 FE compared to RTX 2080 FE and 20% faster than RTX 2080 Ti FE.
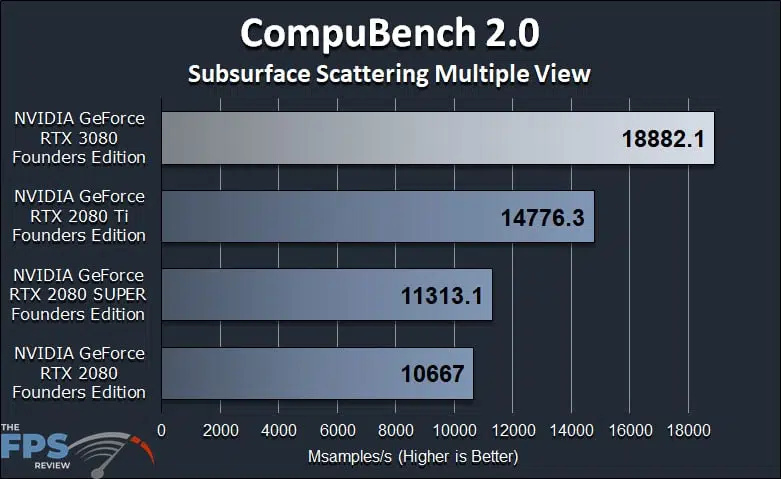
Subsurface Scattering Multiple View is 77% faster on the RTX 3080 FE compared to RTX 2080 FE and 28% faster than RTX 2080 Ti FE.
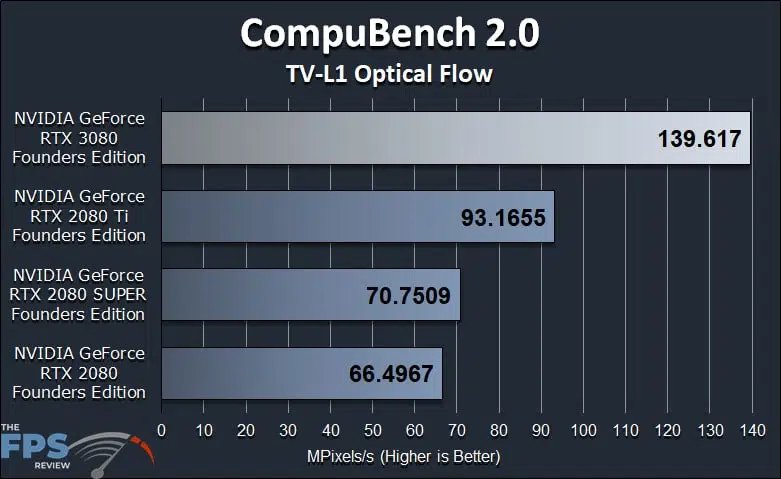
TV-L1 Optical Flow is a large 110%, more than double, the performance of the GeForce RTX 2080 FE. It’s 50% faster than the RTX 2080 Ti FE.