Synthetic Storage Benchmarks
PCMark 10
We are using PCMark 10’s Full System Drive Storage Benchmark. It outputs an overall score (higher is better) that is derived from the Bandwidth (higher is better) as well as access time (lower is better) results.
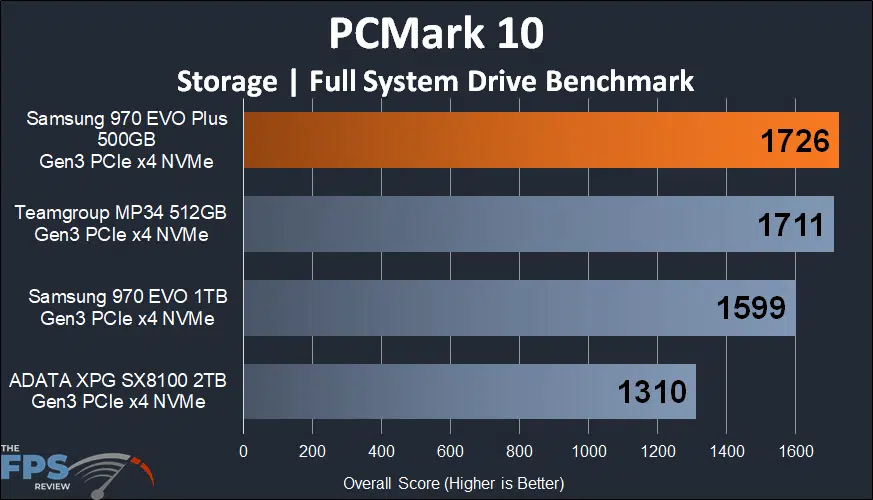
The overall PCMark 10 score for the Samsung 970 EVO Plus 500GB SSD turns out to be 1726, which is 8% better than the Samsung 970 EVO 1TB SSD, a definite marked improvement. Right now, it sits at the top of the chart, even slightly faster than the Teamgroup MP34 512GB SSD.
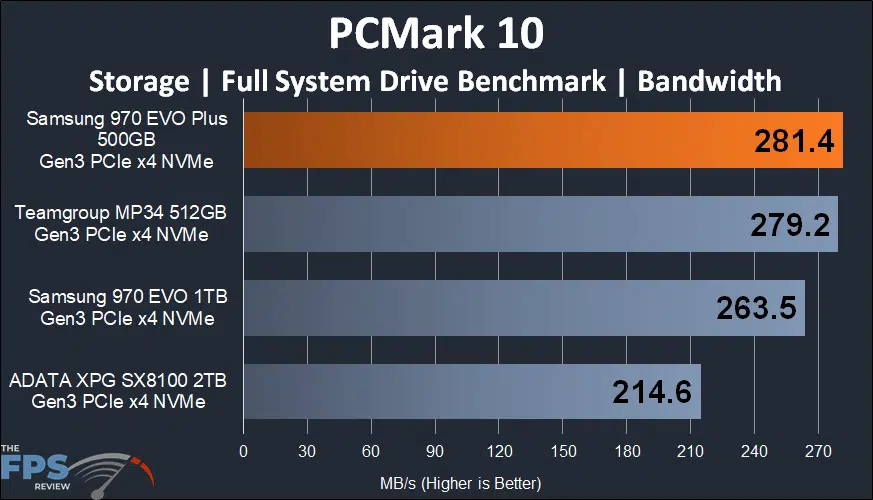
The Bandwidth or amount of I/O execution is greatest on the Samsung 970 EVO Plus 500GB SSD here. It’s 7% greater than the Samsung 970 EVO 1TB and slightly faster again than the Teamgroup MP34.
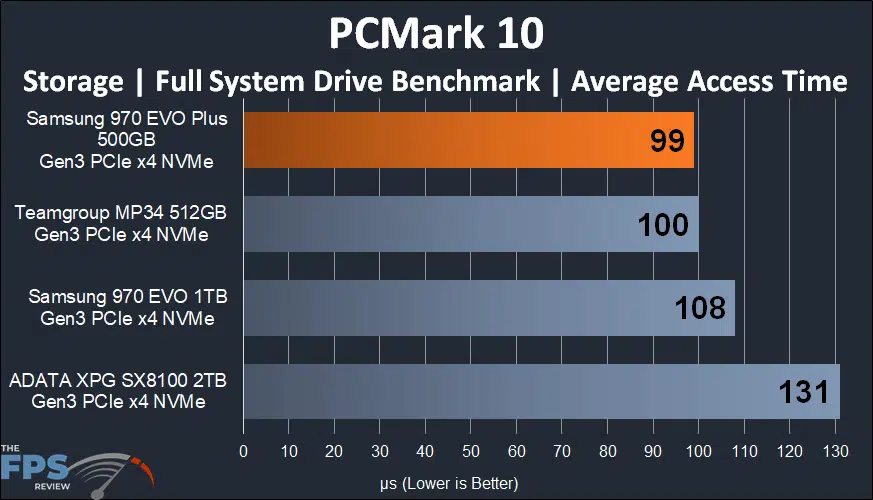
In terms of Average Access Time, the Samsung 970 EVO Plus pulls in the best score, which is 8% faster than the Samsung 970 EVO 1TB and on par with the Teamgroup MP34.
PassMark PerformanceTest
We are using PassMark’s PerformanceTEST Disk Mark benchmark only. This test benchmarks Disk Sequential Read, Disk Sequential Write, IOPS 32KQD20, IOPS 4KQD1 tests and outputs an overall score (higher is better.)
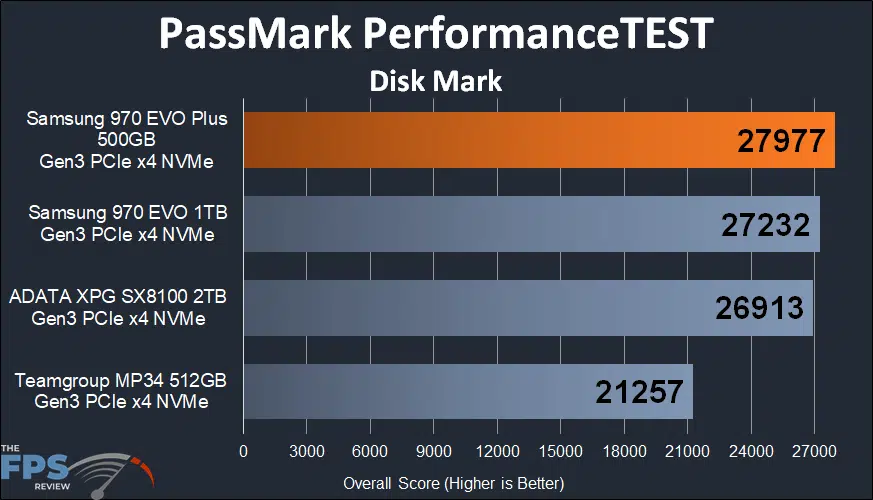
In PassMark’s PerformanceTest Disk Mark overall result the Samsung 970 EVO Plus is at the top of the charts here for PCIe Gen3 drives, but only a smaller 3% faster than the Samsung 970 EVO 1TB SSD. In this benchmark, the SSDs are more tightly packed, except for the Teamgroup MP34, which falls behind.