Throughput Benchmarks (SEQ and RND)
CrystalDiskMark
We are using CrystalDiskMark to benchmark sequential and random throughput of read and write performance. For these NVMe SSDs, we are using the NVMe profile in CrystalDiskMark. This tests SEQ1M Q8T1, SEQ128K Q32T1, RND4K Q32T16, and RND4K Q1T1.
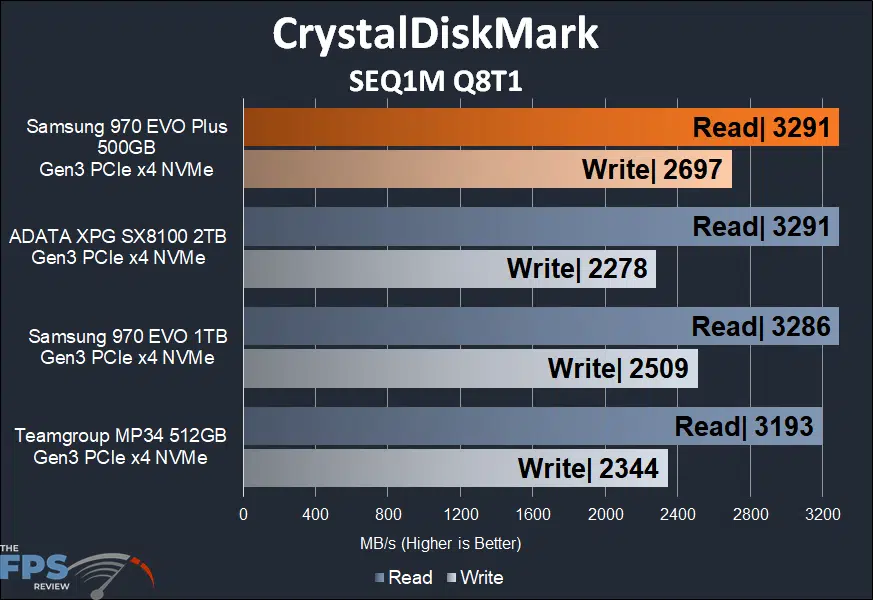
In CrystalDiskMark SEQ1M Q8T1 we are looking at read and write performance, and the Samsung 970 EVO Plus 500GB is coming out on top here. The quoted sequential read speed is 3500MB/s, we aren’t quite hitting that theoretical maximum read, but we are coming close. It’s just a slight advantage over the Samsung 970 EVO 1TB, and on par with the ADATA XPG SX8100 read. In terms of write, the 970 EVO Plus is rated at 3200MB/s, and we are hitting 2697MB/s, which is shy of that mark. However, compared to the other SSDs it is the fastest write performance. It also beats the Samsung 970 EVO 1TB by 7% faster on write speeds.
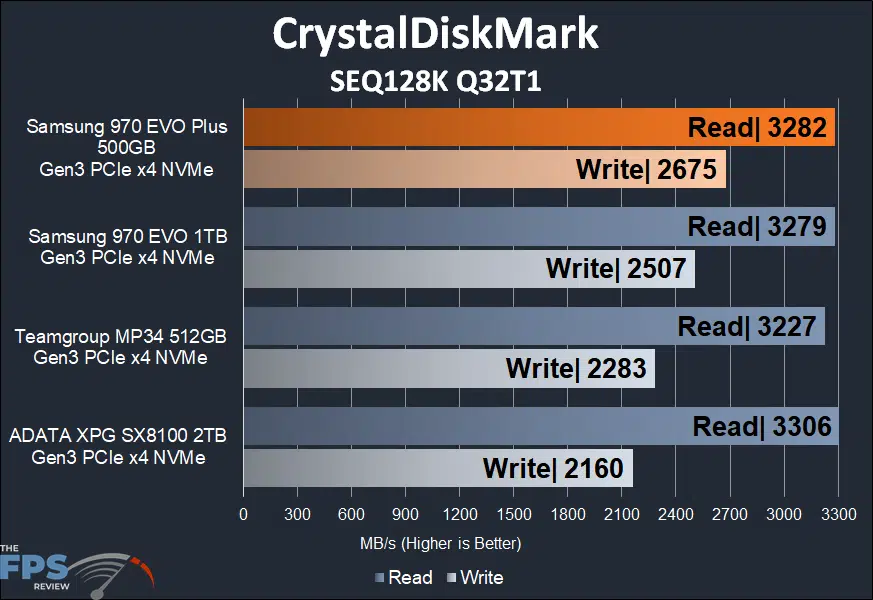
We pretty much see the same pattern in SEQ128K Q32T1 tests, except the Teamgroup MP34 and ADATA XPG SX8100, falls backwards a bit more, especially in write performance. Write performance is much improved on the Samsung 970 EVO Plus 500GB SSD.
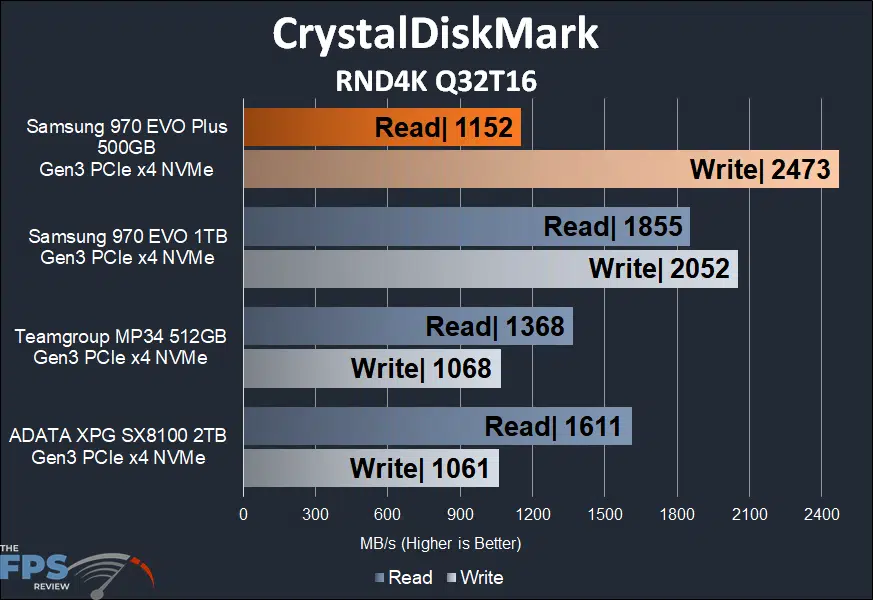
This graph is quite drastic, in RND4K Q32T16 performance. The Samsung 970 EVO Plus 500GB is vastly faster in write performance, especially compared to the Teamgroup MP34 and ADATA XPG SX8100. Compared to the Samsung 970 EVO 1TB the write performance is 21% faster with the updated Samsung 970 EVO Plus 500GB, that’s pretty major. Random read performance falls behind the other drives, but this could be related to higher latencies.
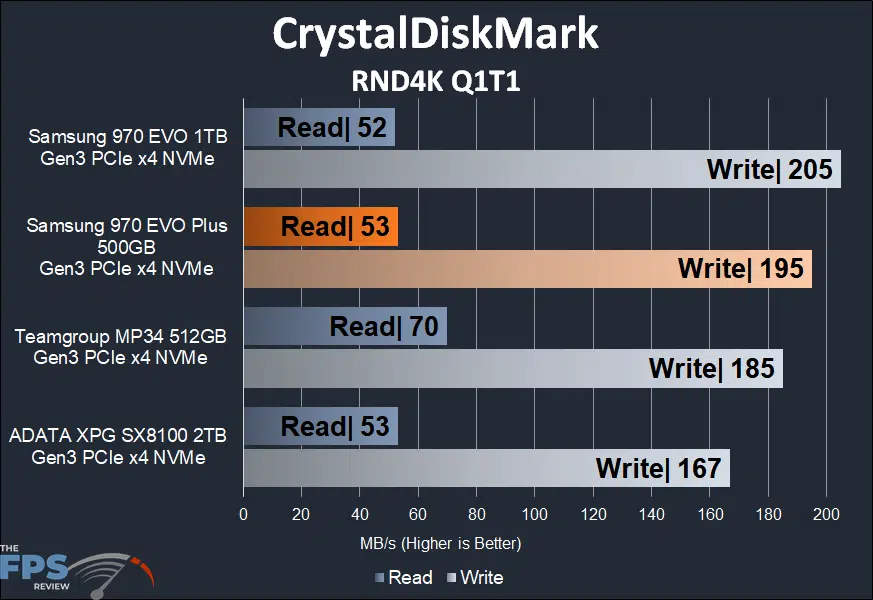
In RND4K Q1T1 performance we are seeing the older Samsung 970 EVO 1TB perform faster on write performance, and this could be simply down to the difference in DRAM cache sizing or SLC cache sizing. The read speed is pretty much the same between the drives.