Power Temp and Frequency on 7800X3D
On this page, we are going to investigate the AMD Ryzen 7 7800X3D power draw, temperature, and frequency when the CPU is stressed to the max on an all-core (multi-core) workload. This test loads all the cores running Cinebench R23 multi-core test. Note that game load, while gaming, would be different from this stress test of all cores.
Power

AMD has raised the TDP on the Ryzen 7 7800X3D to 120W, versus the 105W of the Ryzen 7 7700X. However, when running all-core testing the result is quite different. One reason for this is the change in the TjMax temperature to 89c on the 7800X3D, so with it not allowing a higher temperature, also means lower power. The AMD Ryzen 7 7800X3D comes in at an all-core load of 93W of package power usage, versus 144W on the Ryzen 7 7700X due to the difference in boost clocks. Therefore, Ryzen 7 7800X3D uses 35% less power than the Ryzen 7 7700X when maxing out all cores in Cinebench R23. Compared to the Ryzen 7 5800X3D the 7800X3D also uses less power at 30% less power usage.
Above all the CPUs the Intel Core i5-13600K eats the most power and uses a whopping 138% more power draw than the Ryzen 7 7800X3D! That’s a massive amount of power difference for very very very little gaming performance differences. The Ryzen 7 7800X3D is massively more efficient. Yet, at the same time, we wouldn’t have minded say another 20W-30W of power usage for maybe a couple of hundred MHz faster boost clock as well on the 7800X3D, it would have still used less power than the 7700X even with 20W-30W more power for higher clock speed.
Temperature

Along with the power reduction, efficiency, and lower boost clocks also come lower temperatures. Plus, the biggest factor here is that AMD has lowered the TjMax to 89c on the Ryzen 7 7800X3D. In an all-core test, our CPU maxed out at 83c running in Cinebench R23. This is therefore 13% cooler than the Ryzen 7 7700X and 8% cooler than the 13900K and 5800X3D.
CPU Clock Frequency
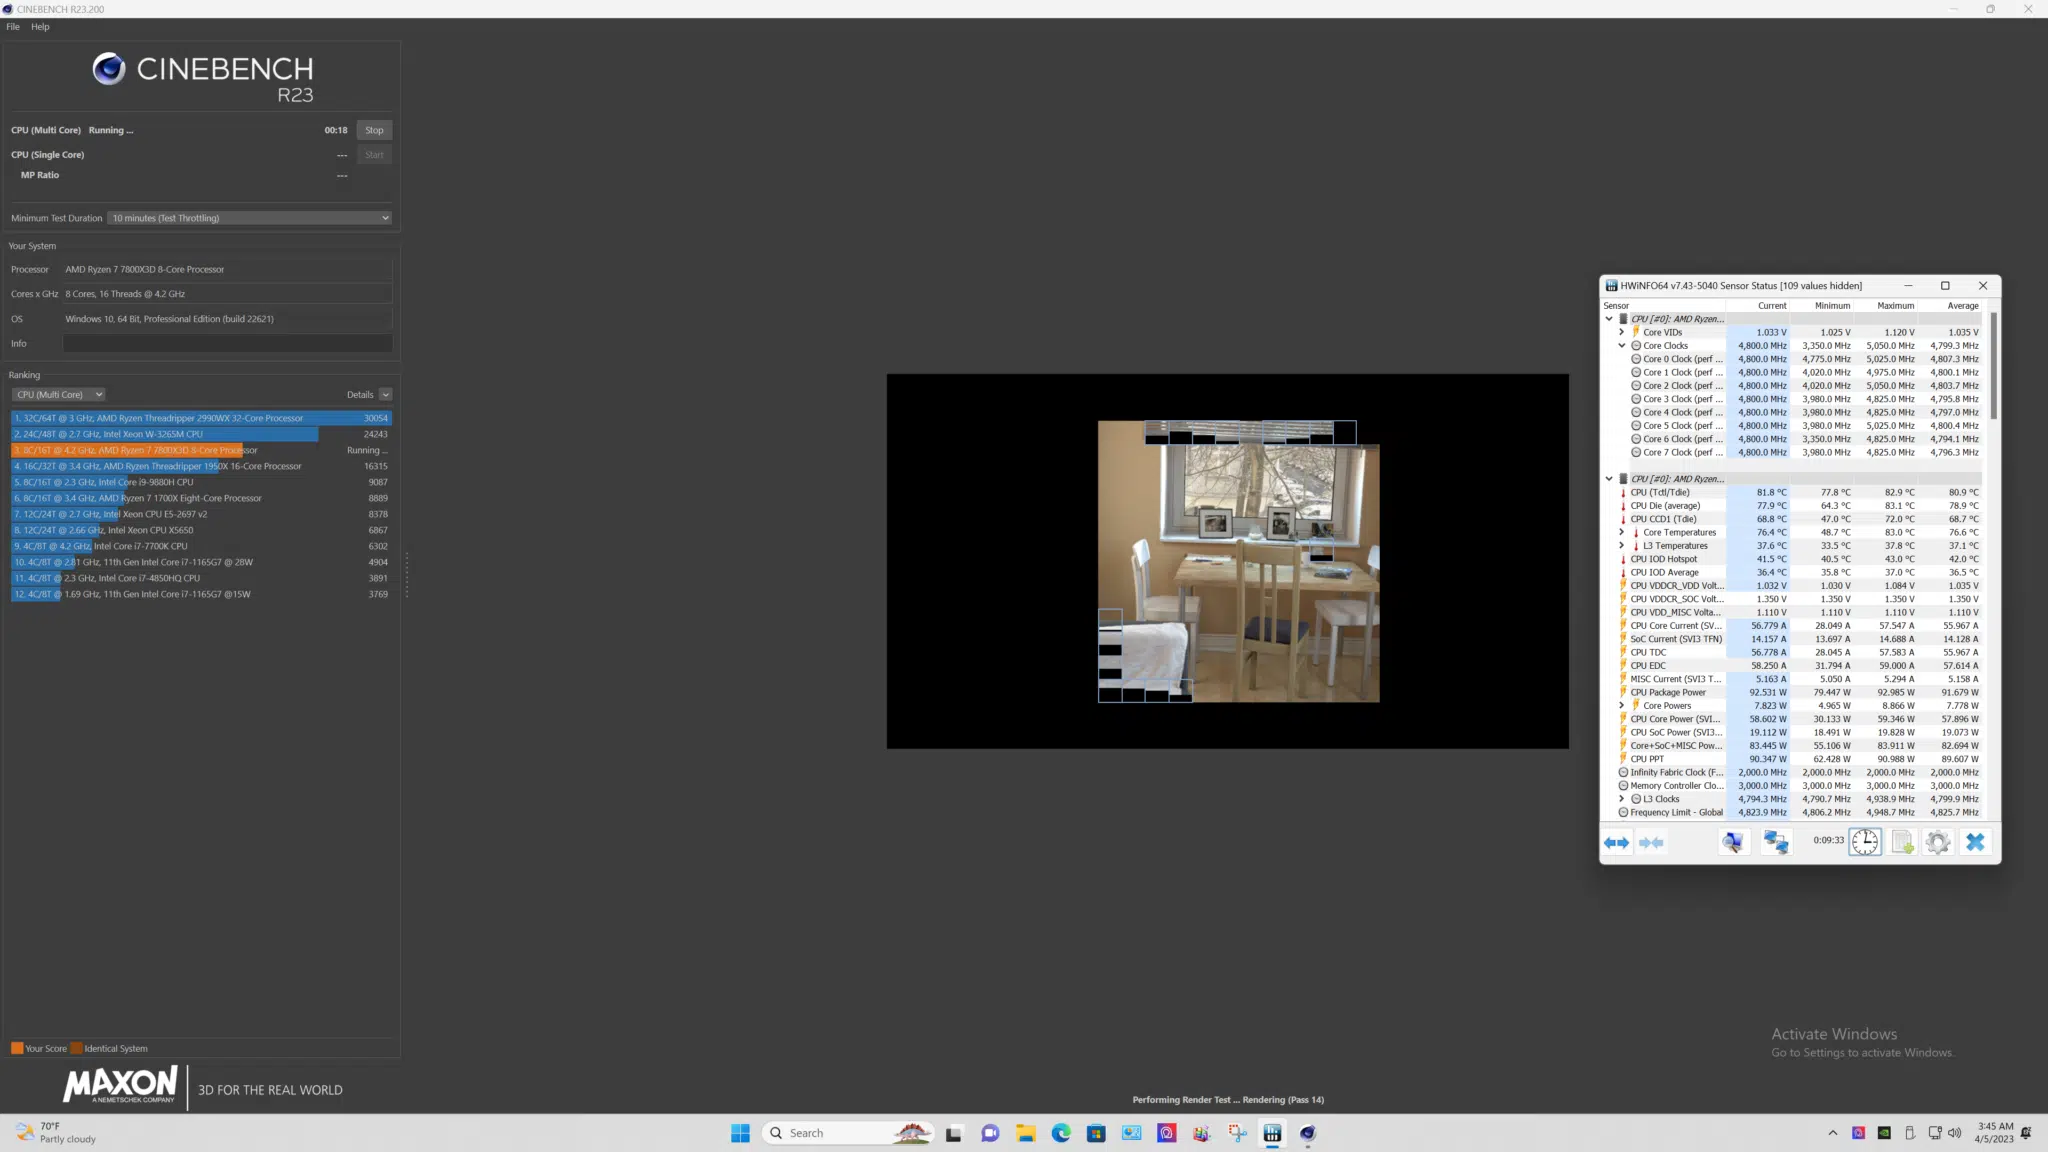
We have been talking a lot about clock frequency, so we had to look at what the Ryzen 7 7800X3D actually boosts at compared to the Ryzen 7 7700X in all-core multi-core testing. We have made the table below, and screenshots of HWiNFO64 as well.
| 7800X3D | 7700X | 5800X3D | 13600K | |
|---|---|---|---|---|
| Observed All-Core Boost | 4.8GHz | 5.175GHz | 4.25GHz-4.275GHz | P-Core: 5.1GHz E-Core: 3.9GHz |
The most notable information to take away is the difference between the Ryzen 7 7800X3D and Ryzen 7 7700X when running the all-core boost frequency. The Ryzen 7 7700X has a rated boost frequency of 5.4GHz and hits 5.175GHz on all cores when maxed out, a difference of 225MHz. The Ryzen 7 7800X3D has a rated boost frequency of 5GHz and hits 4.8GHz on all cores when maxed out, a difference of 200MHz. The two CPUs are very similar in this way with the difference between their rated boost frequency and their actual all-core frequency.
However, the difference between the two CPUs when comparing their real-world actual all-core frequency is much wider at 375MHz per-core difference between them. That’s a fairly significant difference in clock frequency between the two CPUs that can make a difference.
For comparison, the Ryzen 7 5800X3D was rated at a boost clock of 4.5GHz and hit 4.25-4.275GHz, a difference of 250MHz. This means the 7800X3D is an improvement over the 5800X3D in this regard of the difference between its rated boost and the actual boost.
We would still advocate that it would have been acceptable to have 20W-30W (at least) to give the 7800X3D the ability to hit 200MHz higher than it is when gaming, or for the all-core load. We would have liked to see the 7800X3D at 5GHz for the all-core load, and maybe 5.2GHz while gaming. It certainly would have made it a more interesting CPU. Also keep in mind that frequencies when using fewer cores would result differently, for example when gaming. We will most likely do some further testing in the future while gaming to see how that compares. For now, we wanted to give you these stress test numbers.