Synthetic System Benchmarks
We are going to start with synthetic system application benchmarks on this page. Note that the graphs are arranged from fastest to slowest. The Ryzen 7 8700G and Ryzen 5 8600G are in blue, while the Ryzen 7 5700G is in grey.
PCMark 10
PCMark 10 Express
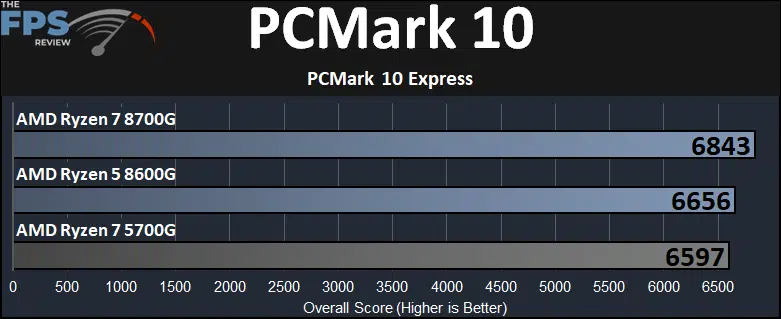
This benchmark focuses mainly on more lightly threaded office application types of workloads. For this, we don’t see huge differences, for example, the Ryzen 7 8700G is only 4% faster than the Ryzen 7 5700G, and the 8600G is only 1% faster. However, this particular system test is a culmination of very simple workloads in the express test. To get a better understanding of wider applications, let’s look at the other synthetic tests below.
Geekbench 6
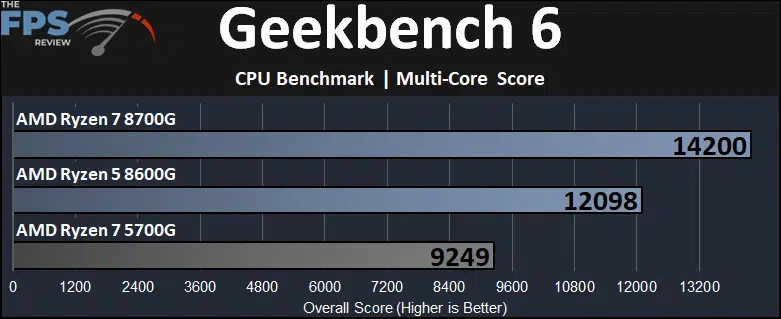
In Geekbench 6 Multi-Core performance we are now looking at multi-core performance, and for this, we actually see bigger differences between generations. The 8700G is 54% faster than the 5700G, which is impressive since they are both 8-core/16-thread CPUs. This shows the huge generational bump the 8700G has over the 5700G from Zen 3 to Zen 4 and DDR4 to DDR5. In fact, what’s even more impressive is the Ryzen 5 8600G beating the 5700G by 31% which is a 6-core/12-thread CPU beating the 8-core/16-thread CPU. The difference between the 8700G and 8600G is 17% in performance.
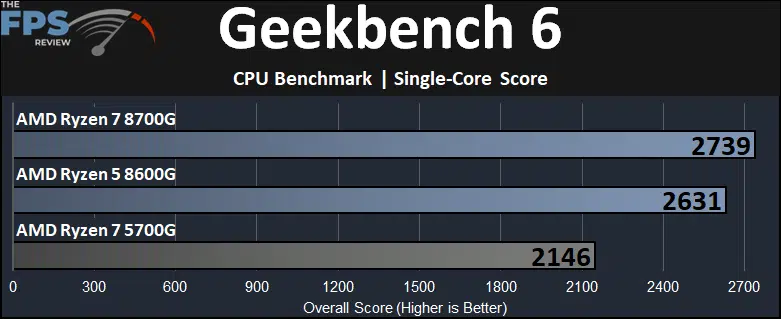
The single-core performance is also much better on Zen 4 compared to Zen 3 with these new APUs. The 8700G is 28% faster than the 5700G and the 8600G is 23% faster. The difference between the 8700G and 8600G is just 4% in single-core performance.
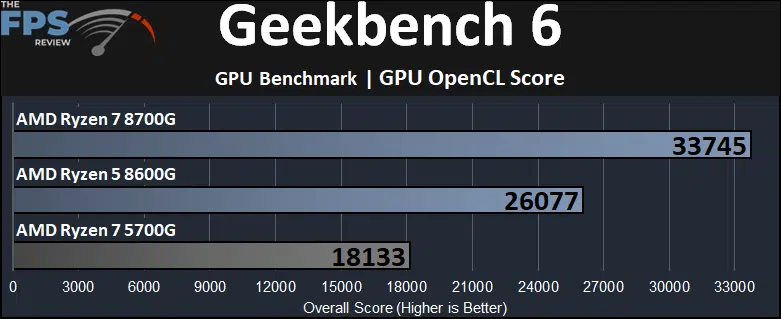
We also ran the GPU OpenCL test, to test the difference between the Radeon 700M graphics and Vega 8 graphics. The new 8700G is 86% faster in OpenCL compared to the 5700G and the 8600G is 44% faster. The difference between the 8700G and 8600G is 29%.
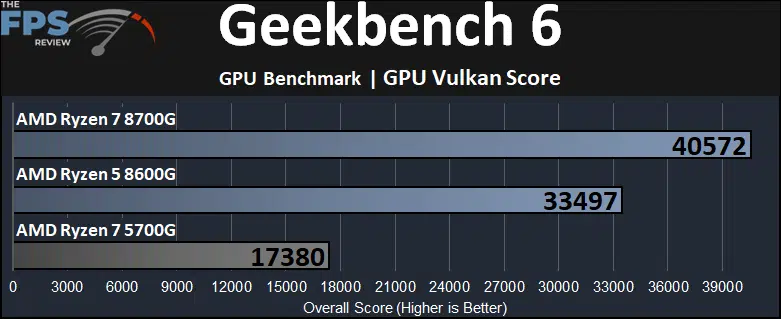
We also ran the GPU Vulkan test to see how that scales between the graphics. The 8700G is 133% faster than the 5700G and the 8600G is 93% faster. The difference between the 8700G and 8600G is 21%.
3DMark CPU Profile
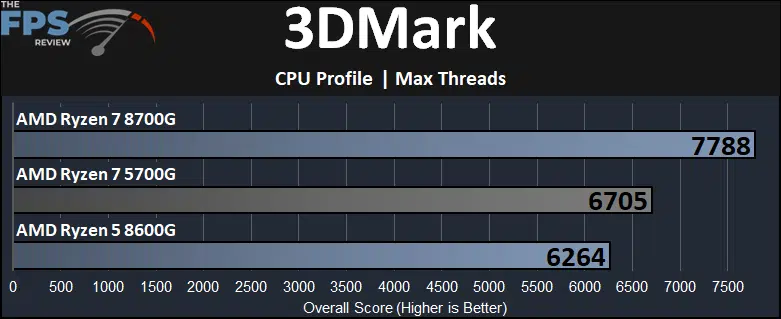
In 3DMark’s CPU Profile test, we are running the “Max Threads” test and looking at overall performance. In this one, the thread count really matters, so that is why the 5700G sits above the 8600G in this test, the 8600G is a 6-core/12-thread CPU while the 5700G is an 8-core/16-thread CPU. The 8700G is 16% faster than the 5700G and is 24% faster than the 8600G.
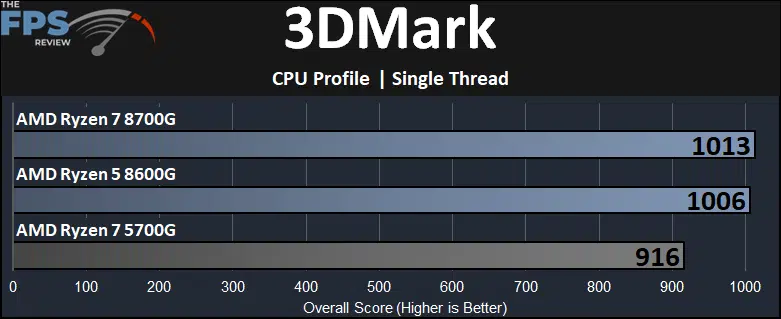
In the single-thread testing, the 8700G is 11% faster than the 5700G and just a 1% difference compared to the 8600G.
PassMark
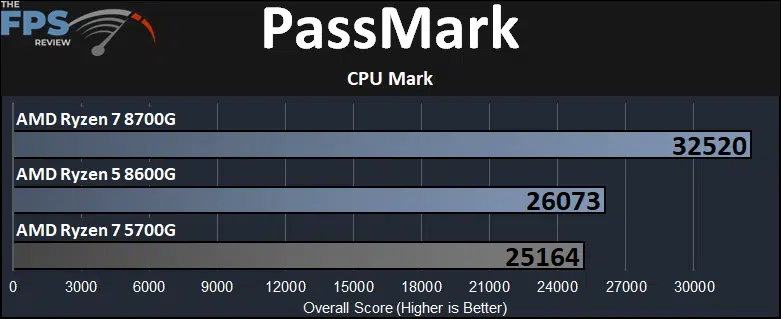
In PassMark CPU Mark the 8700G is 29% faster than the 5700G and the 8600G is 4% faster than the 5700G, which is great considering it has fewer cores/threads.