System Storage Benchmarks
For our SSD comparisons today, we are including the Netac NV7000 and Netac NV7000-t as they are direct relevant comparisons to see how the new Netac NV7000-Q compares. Keep in mind that the Netac NV7000-Q is the only QLC drive listed on these graphs, all other drives are TLC.
3DMark
We are using 3DMark’s Storage Benchmark which tests common gaming workload traces. The benchmark tests loading Battlefield V, Call of Duty Black Ops 4, and Overwatch. It tests moving games by copying a Steam folder for CS:GO, and installing Outer Worlds from the Epic Games Launcher, and saving game progress in The Outer Worlds. It tests recording a 1080p gameplay video at 60FPS with OBS while playing Overwatch. We will graph the Overall Benchmark Score, higher is better.
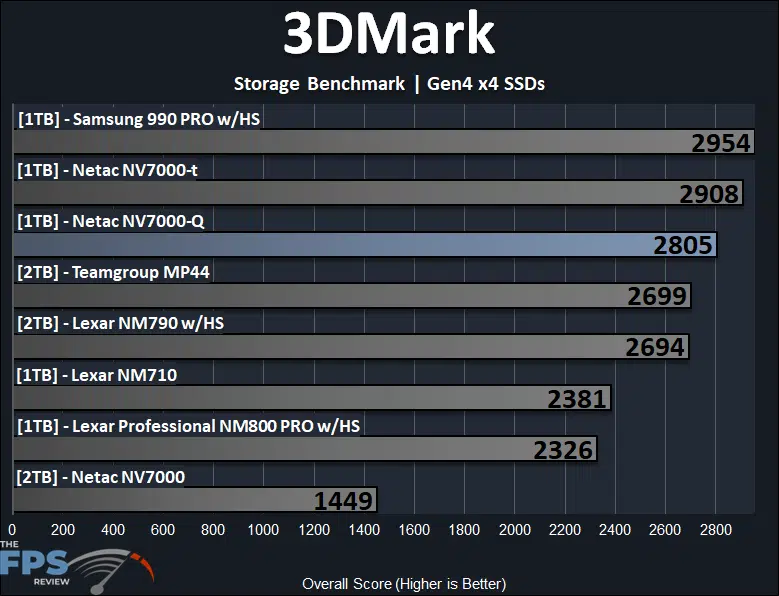
In our review, in the 3DMark Storage Benchmark, the Netac NV7000-Q 1TB PCIe Gen4x4 NVMe SSD performs quite well in 3DMark’s storage gaming-based benchmark. At a score of 2805 the Netac NV7000-Q is an impressive 94% faster than the Netac NV7000 2TB SSD, showing a big difference in these game-oriented benchmark traces. The Netac NV7000-Q is also beating the Lexar SSDs, and even the Teamgroup MP44 by 4%. The Netac NV7000-Q seems to be 4% slower than the Netac NV7000-t, sitting just under it, which isn’t too far off. The Samsung 990 PRO is the fastest SSD, but also the most expensive.
PCMark 10
We are using PCMark 10’s Full System Drive Storage Benchmark. It outputs an overall score (higher is better) that is derived from the Bandwidth (higher is better) as well as access time (lower is better) results.
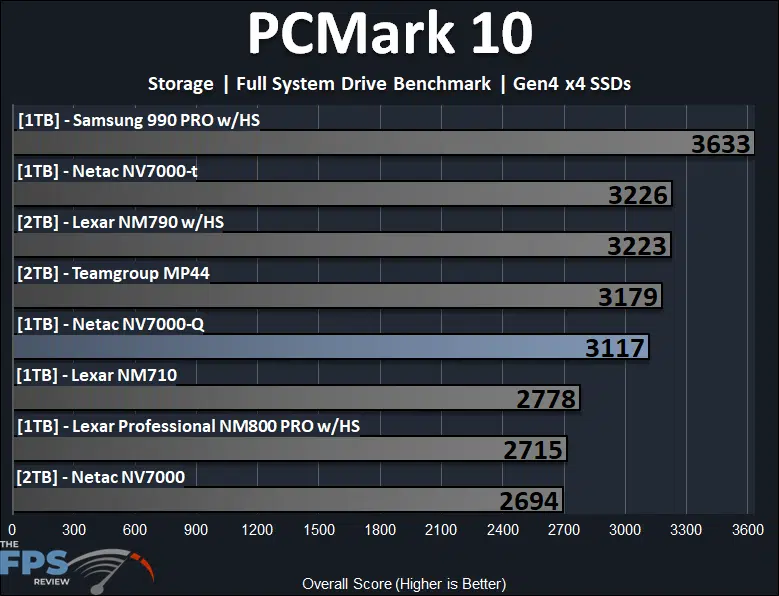
In PCMark 10’s full system drive storage benchmark, the Netac NV7000-Q 1TB PCIe Gen4x4 NVMe SSD is still faster than the Netac NV7000, this time by 16% in PCMark 10’s storage test. It is also faster than the Lexar NM710 and Lexar NM800 PRO, however, the Teamgroup MP44 does edge it out. The Netac NV7000-Q is only 3% behind the Netac NV7000-t, which is very close in performance, just slightly faster.
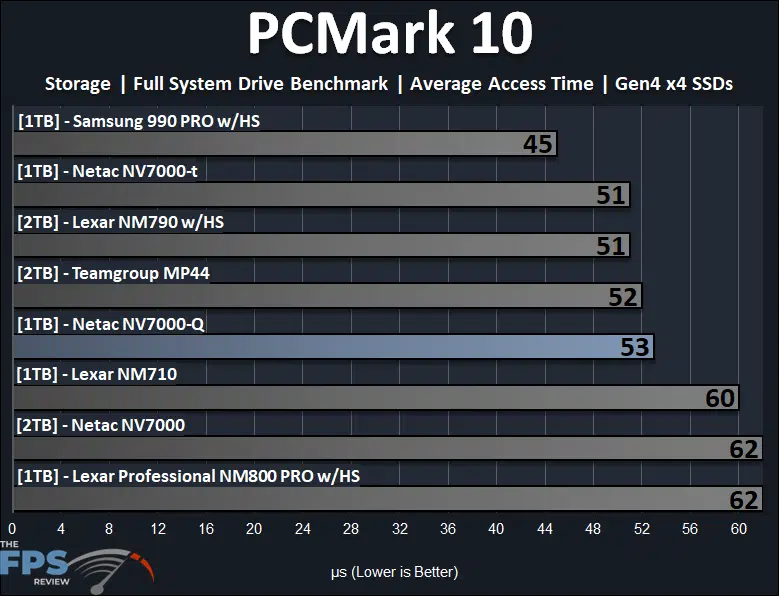
The average access time test in PCMark 10’s Storage Benchmark shows you a closer look at where things line up. The Netac NV7000-Q 1TB PCIe Gen4x4 NVMe SSD doesn’t have the fastest access times, but it is still very competitive and remains in the lower 50’s which is average and on par with many drives like the Teamgroup MP44, Lexar NM790, and Netac NV7000-t. The Netac NV7000-Q and Netac NV7000-t are once again very close in performance. We also see a nice improvement in access time compared to the Netac NV7000. The Netac NV7000-Q has a 15% decrease in access time compared to the Netac NV7000, improving upon that drive quite a bit.
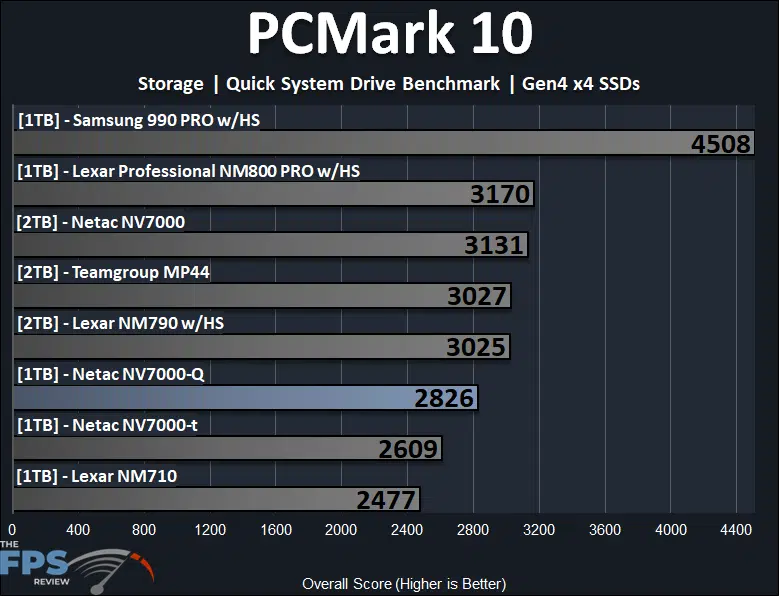
If there is one area where the Netac NV7000-Q 1TB PCIe Gen4x4 NVMe SSD falls behind, it is in the PCMark 10 Quick System Drive test which stresses small workloads that benefit from a DRAM-cache lookup table. The SSDs that lack a DRAM cache, rely on Host Memory Buffy, and this is where we see that realized. This is why the Netac NV7000-t and Netac NV7000-Q are trailing.
However, what you will notice is that the Netac NV7000-Q is ahead of the Netac NV7000-t in performance! That is the important part to note here, as the Netac NV7000-Q has a larger buffer for the controller, and with improvements, the Netac NV7000-Q is 8% faster than the Netac NV7000-t despite both not having a DRAM cache. Though, you can see SSDs that do have DRAM-cache are much faster, the Netac NV7000-Q is 10% behind the Netac NV7000.
PassMark PerformanceTEST
We are using PassMark’s PerformanceTEST Disk Mark benchmark only. This test benchmarks Disk Sequential Read, Disk Sequential Write, IOPS 32KQD20, IOPS 4KQD1 tests and outputs an overall score (higher is better.)
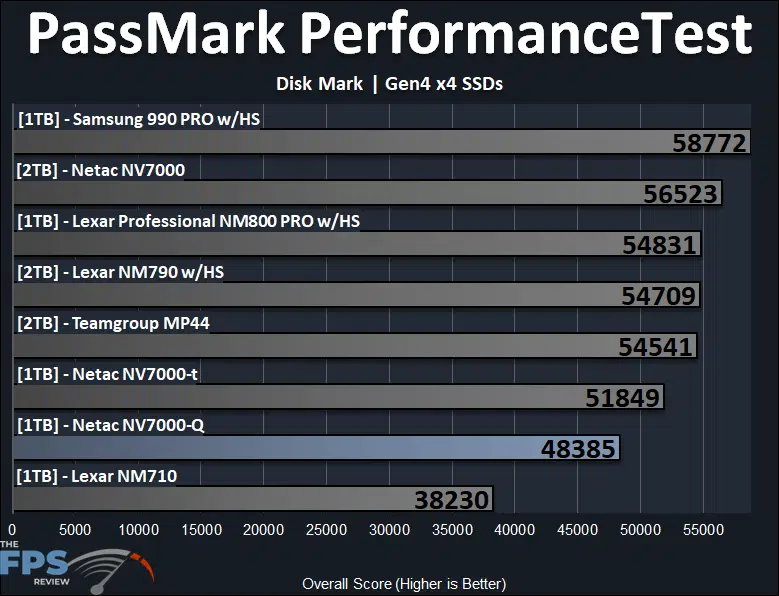
In PassMark PerformanceTest Disk Mark this benchmark takes everything into consideration, small workloads, large workloads, access time, and DRAM cache, and here the Netac NV7000-Q is behind the Netac NV7000-t by 7%, which is not a large amount. However, the Netac NV7000 is ahead by 17%.