Power Temperature and Frequency
On this page, we are going to investigate the Intel Core i9-14900K power draw, temperature, and frequency. This is a stress test, which means we are pushing each CPU to its maximum potential in all-core load in the Cinebench R23 multi-core test for 10 minutes.
Power
We use HWiNFO64 sensor data to record the results. We report on the sensor data for “Package Power” in Wattage.
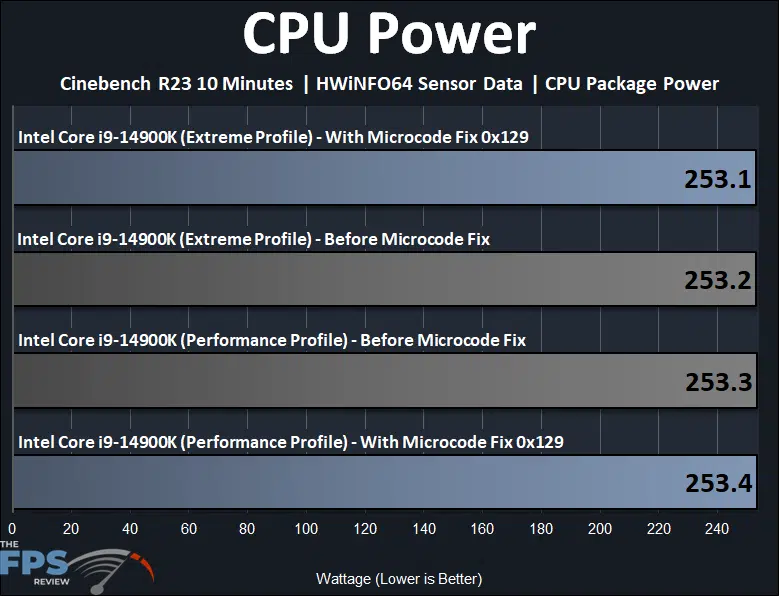
We really didn’t expect the peak power usage to change with the Microcode Fix 0x129 applied since the PL1/PL2 power limits are still in place at 253W. This is the case, there was no change in the maximum power in an all-core load here in Cinebench since PL1 and PL2 are locked at 253W in both the Extreme and Performance Profiles now.
Temperature
We use HWiNFO64 sensor data to record the results. We report on the sensor data for “Tcidle” in Celsius.
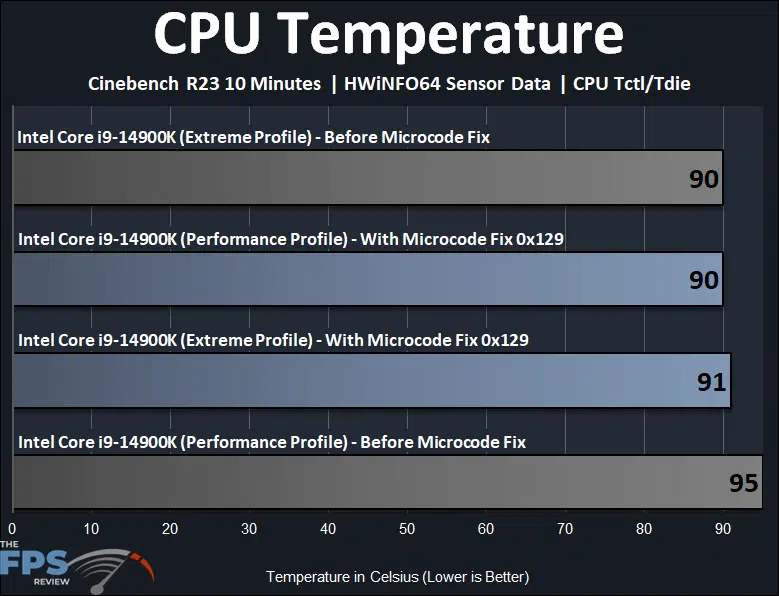
There were some slight temperature differences with the Microcode Fix 0x129 update, however. With the update applied, the Performance Profile’s temps dropped pretty significantly, since the CPU is peaking at less Voltage, it does run slightly cooler. In the Extreme Profile, there was basically no change.
Frequency
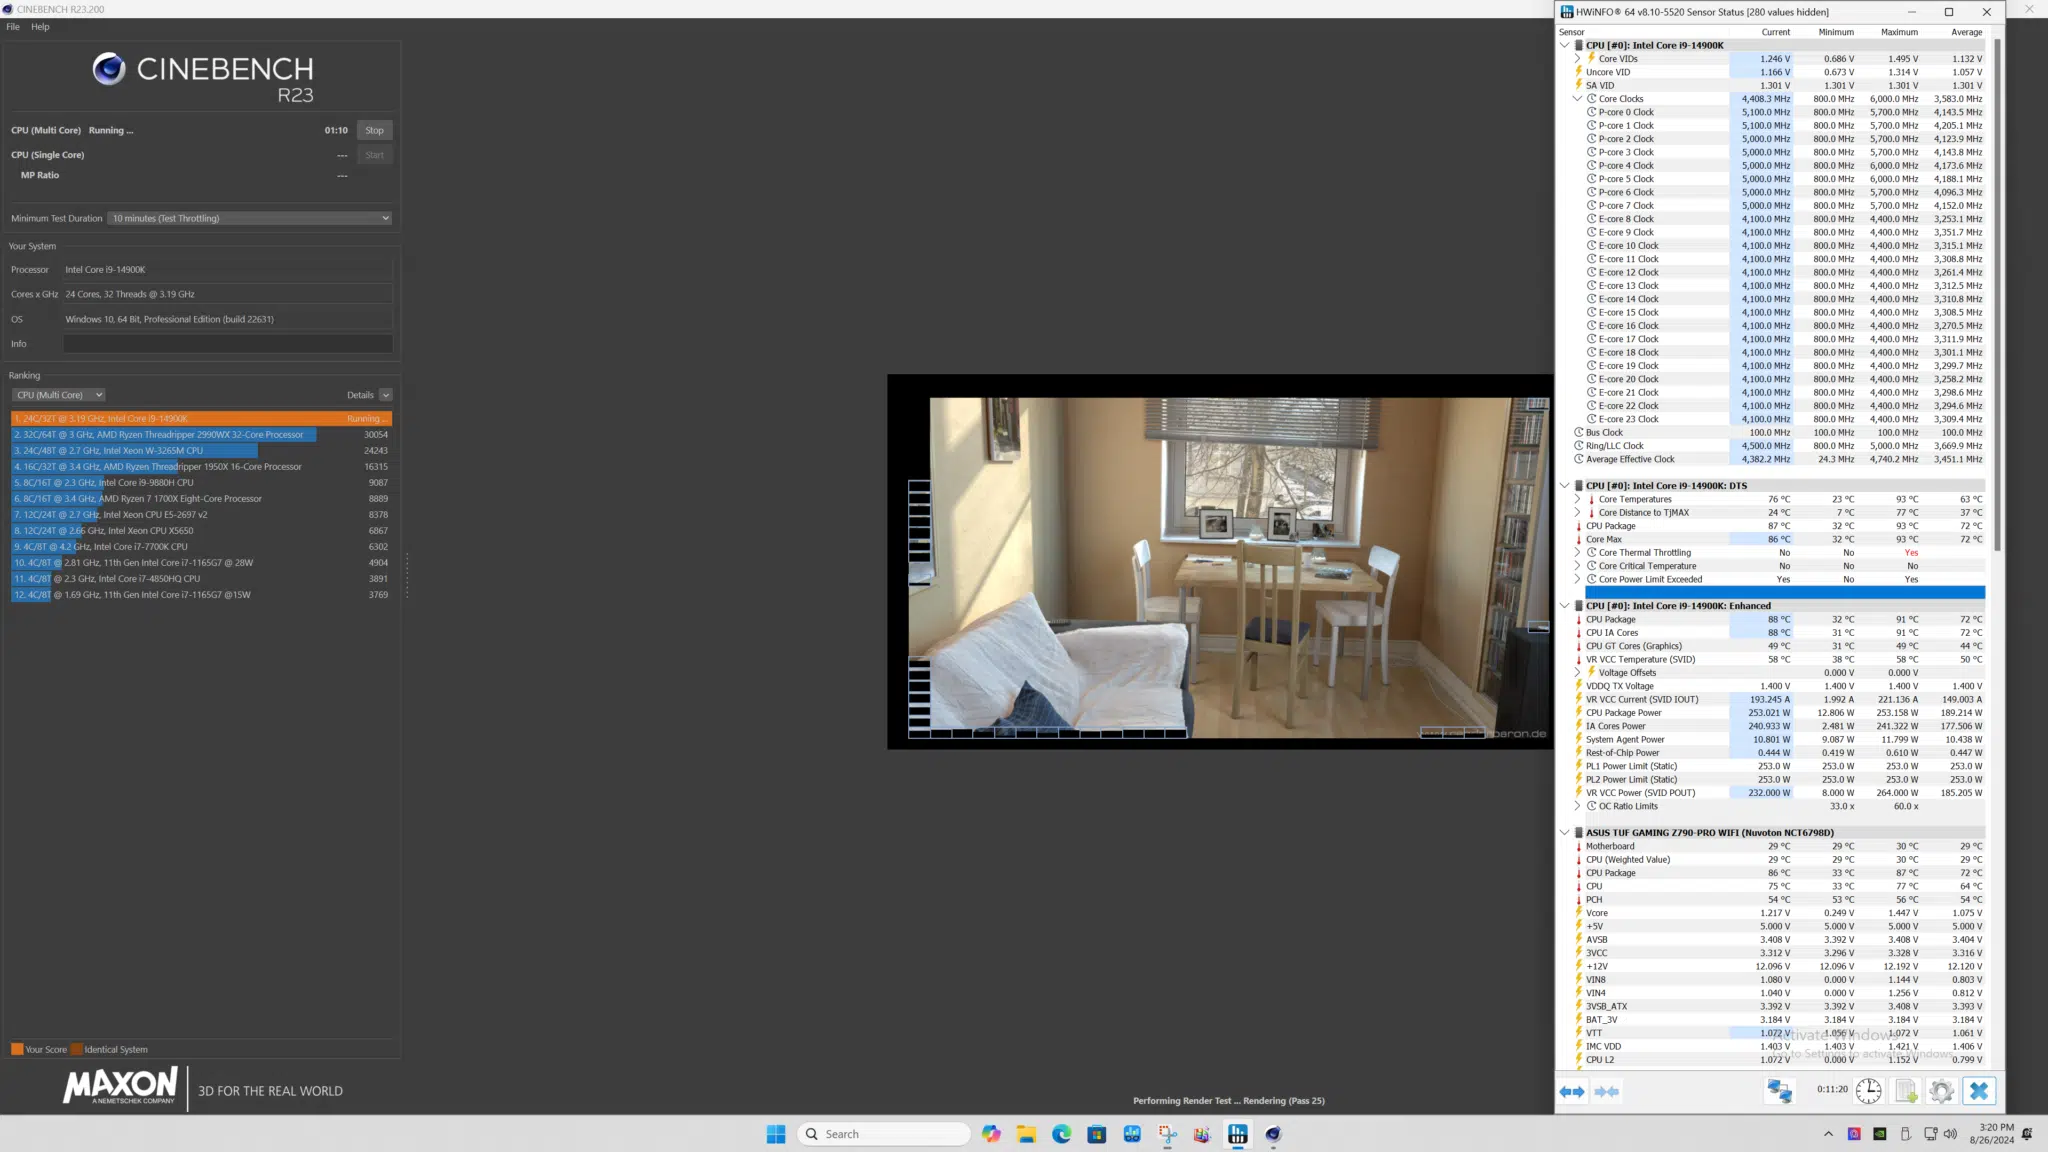
With the Intel Core i9-14900K in the Extreme Profile with the Microcode Fix 0x129 BIOS applied, we experienced an all-core full-load workload in Cinebench to give us about 5GHz-5.1GHz on P-Cores and 4.1GHz on E-Cores. However, only 1 or 2 P-Cores were at the 5.1GHz speed, most were at 5GHz.
If we compare this to performance before the Microcode Fix, also in the Extreme Profile, we experienced the same frequencies, however, one or two more P-Cores at a time were at 5.1GHz before the Microcode Fix update. Therefore, it seems maybe one or two P-Cores have dropped by 100MHz at a given time in a maxed-out, all-core, Cinebench workload, which would explain the slight under 1% performance differences in multi-core workload performance testing.
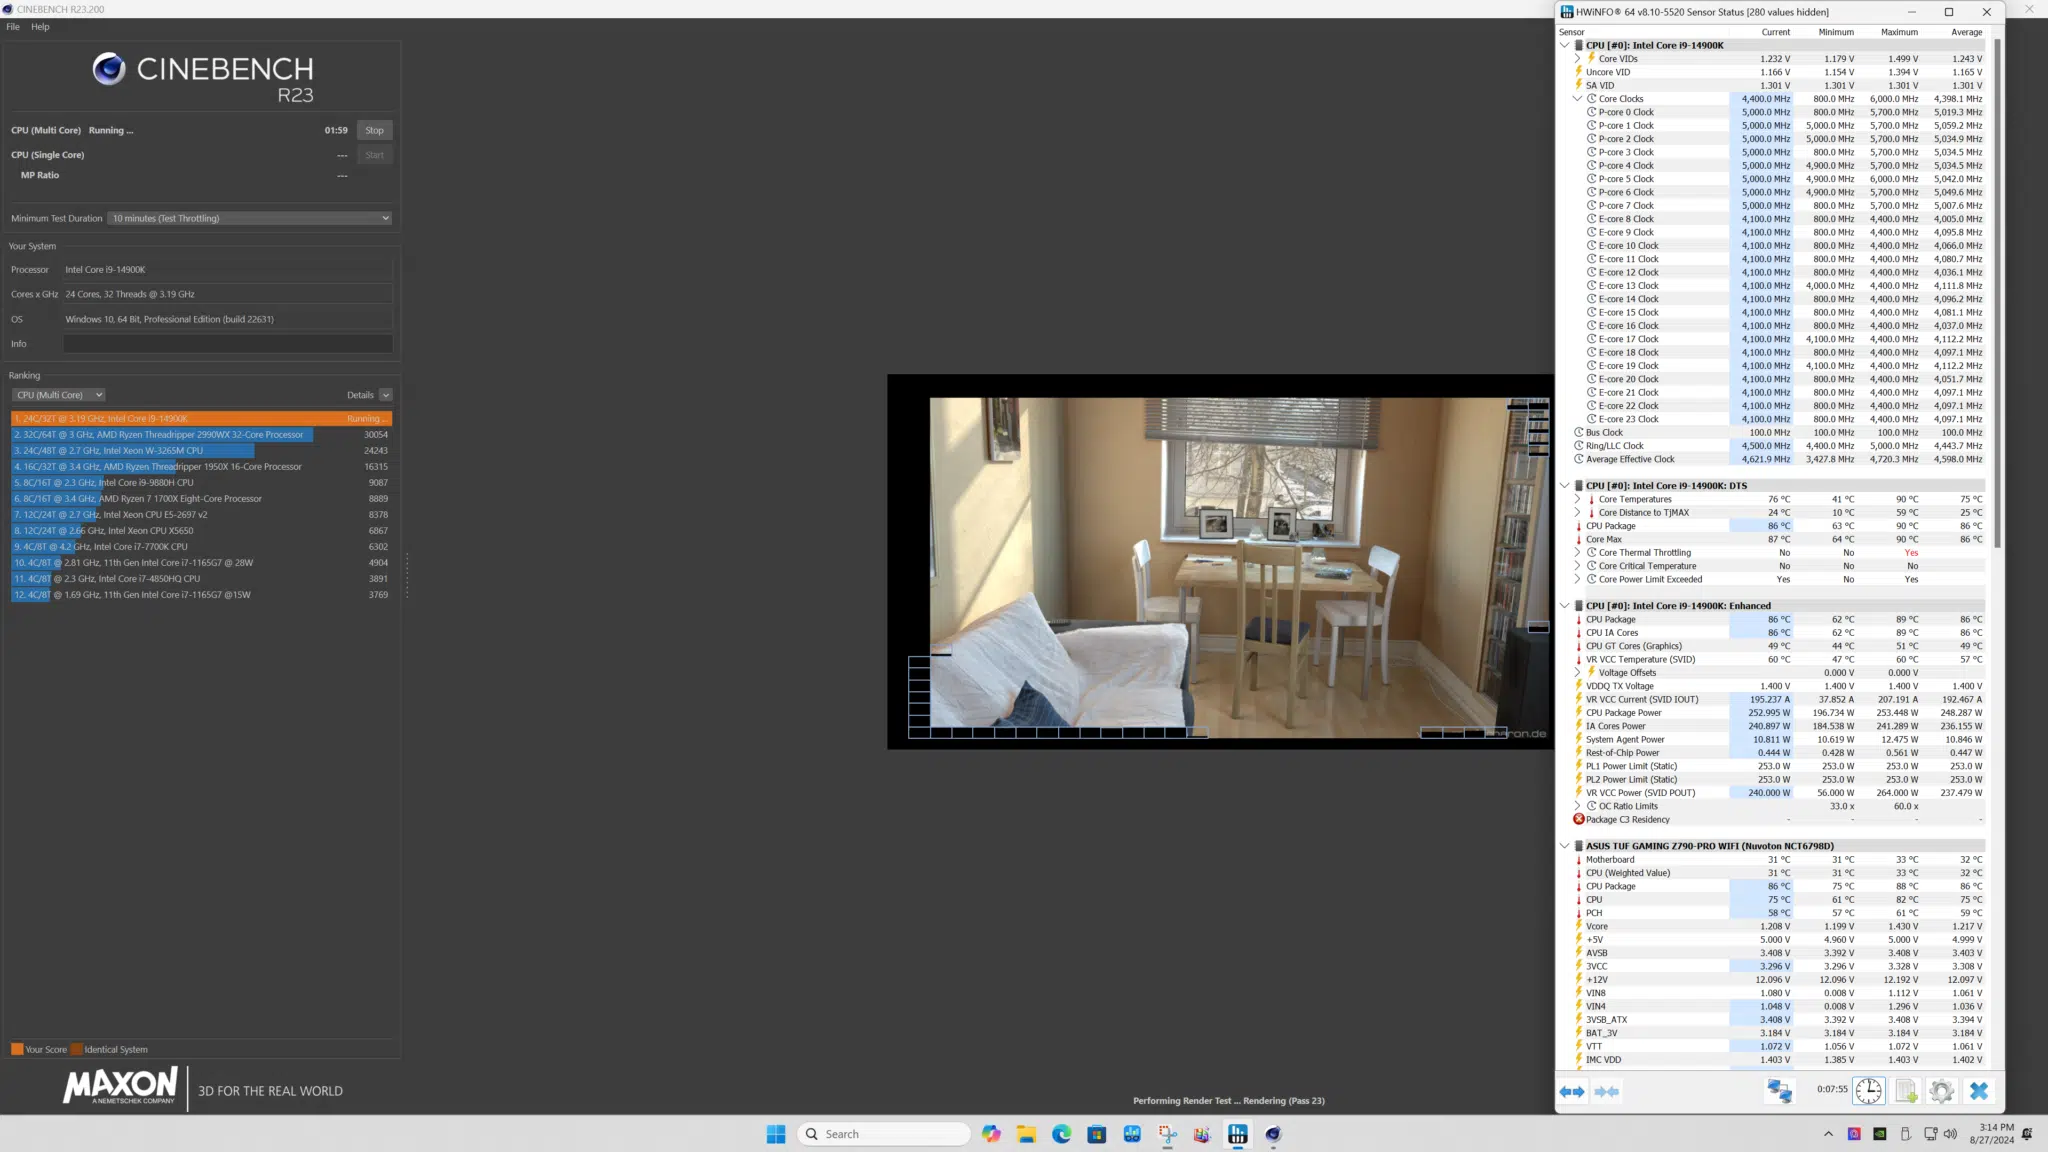
In the Performance Profile with the Microcode Fix 0x129 BIOS applied we experienced all the P-Cores to operate at 5GHz, except for maybe 1 P-Core at a time at 5.1GHz. All the E-Cores were at 4.1GHz.
If we compare this to previous performance before the Microcode Fix 0x129 BIOS, there were about 2 more P-Cores that would also run at 5.1GHz, for a total of 3 P-Cores at 5.1GHz, compared to just 1 P-Core at 5.1GHz with the Microcode Fix 0x129 BIOS applied. Again, it seems about 2 of the P-Cores are reduced by 100MHz with the Microcode Fix 0x129 BIOS applied, which again accounts for the under 1% loss in performance with this new fix in Performance Profile.