Synthetic System Benchmarks
On this page, we will show synthetic benchmarks, some that test a variety of system use-case scenarios, and others that test specific multi-core and single-core/thread workloads to hone in on performance differences.
3DMark CPU Profile
We are testing 3DMark’s CPU Profile, which tests Thread performance and Single Thread performance; we are reporting both on separate graphs. We can customize the number of threads tested, and have done so to isolate differences.
Max Threads
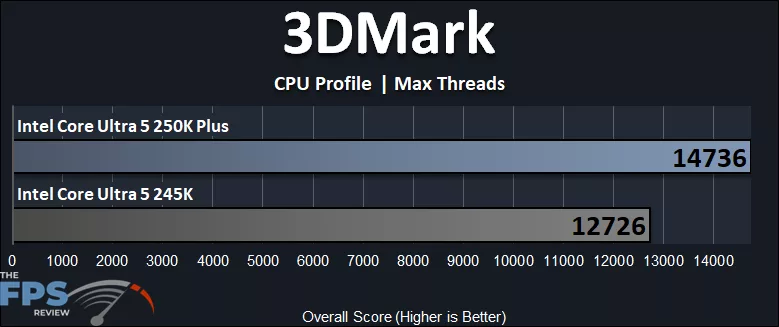
In 3DMark CPU Profile, we have started by setting the test to “Max Threads”, which should show the advantage the Intel Core Ultra 5 250K Plus has over the Intel Core Ultra 5 245K, since it has 18 total threads compared to 14. We can see that the Intel Core Ultra 5 250K Plus is 16% faster than the Intel Core Ultra 5 245K, which indicates the advantage the extra 4 E-Cores make, plus the clock frequency improvement for the P-Cores, and that’s pretty big.
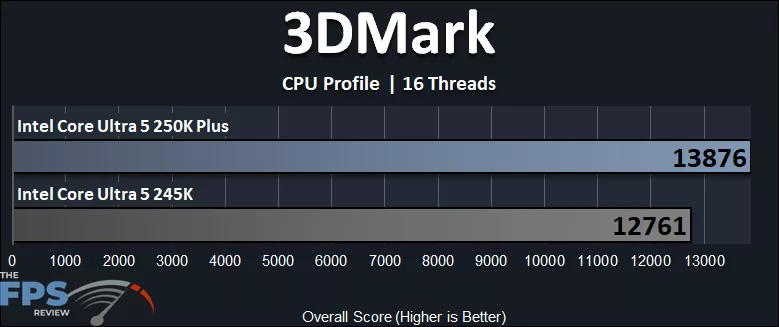
We can customize the settings and now set 16 Threads, which will be interesting, since the Intel Core Ultra 5 245K maxes out at 14 threads, while the Intel Core Ultra 5 250K Plus is 2 threads under its maximum potential. In this scenario, the Intel Core Ultra 5 250K Plus is 9% faster, showing what 2 extra E-Cores can do, plus the clock speed difference.
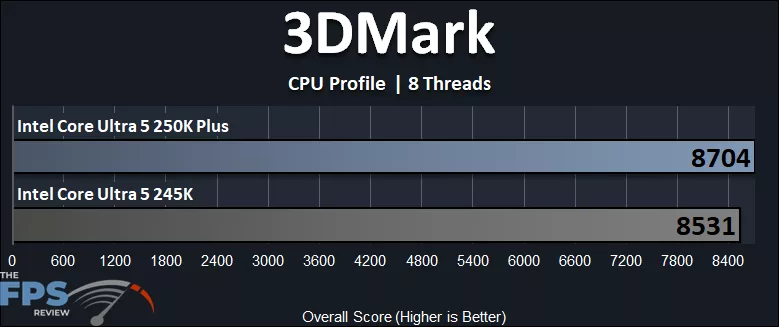
Now we can really hone in more, by reducing the thread count down to 8, now both CPUs are equalized in terms of thread count, utilizing 6 P-Cores and 2 E-Cores. The Intel Core Ultra 5 250K Plus is 2% faster than the Intel Core Ultra 5 245K.
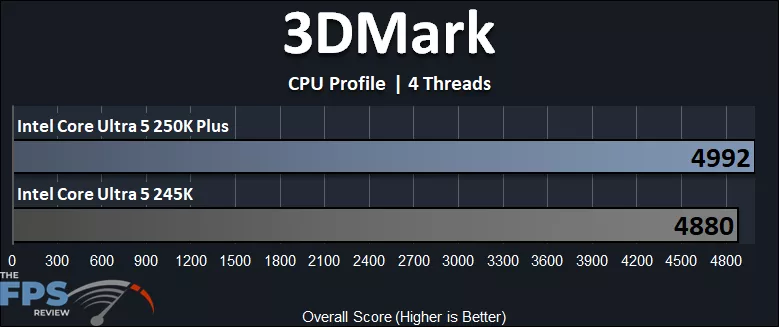
Moving down even further to just 4 Threads, we are now only utilizing 4 P-Cores, equalized between them. The Intel Core Ultra 5 250K Plus is 2% higher performance over the Intel Core 5 245K.
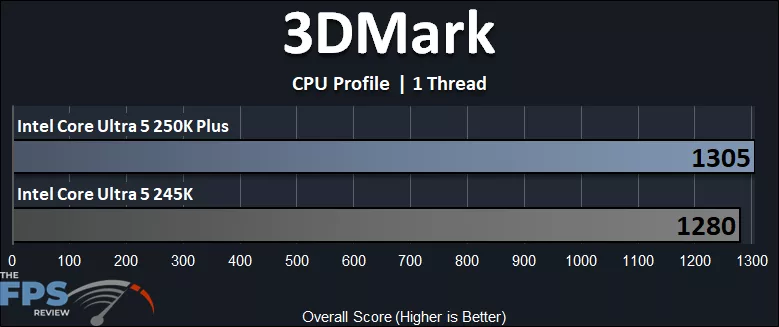
Now for the single-thread or 1 Thread performance testing. Here we see that the performance difference is again 2% faster. The slightly higher 100MHz P-Core clock speed is giving us that slight 2% bump core-to-core between the CPUs.
Geekbench 6.7
Geekbench has had an interesting development with the Intel Core Ultra 200S Plus series CPUs as it relates to the Intel Binary Optimization Tool. You can read all about it here, where it goes into detail. Therefore, we are using the newly released Geekbench 6.7 version for all of our testing today. We will show Multi-Core (nT) and Single-Core (1T) performance in separate graphs.
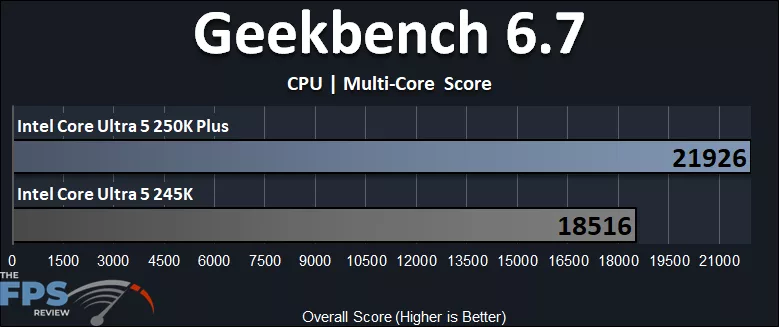
In Geekbench 6.7, the Intel Core Ultra 5 250K Plus is 18% faster than the Intel Core Ultra 5 245K. This benchmark focuses on a more generalized set of workloads, while 3DMark was focused on a single type of workload, very focused. In more generalized tasks, this indicates the Intel Core Ultra 5 250K Plus is overall very impressive compared to the Intel Core Ultra 5 245K for application benchmarks. It seems to be a real step up in performance for applications or multi-threading applications.
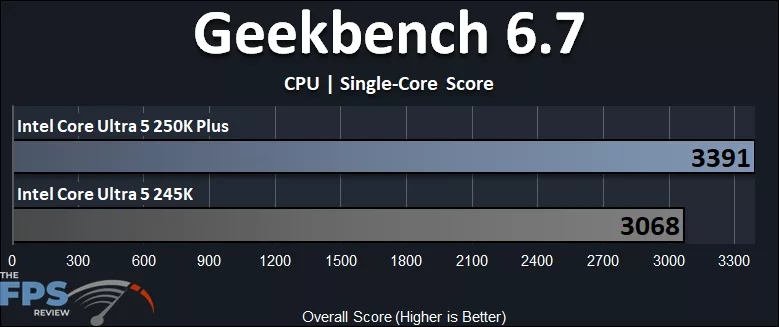
When it comes to the Single-Core score, Geekbench 6.7 reveals that the Intel Core Ultra 5 250K Plus is 11% faster than the Intel Core Ultra 5 245K. This is also very good. We think that extra P-Core boost clock is coming into play here as well, along with the extra E-Cores.
PassMark PerformanceTEST
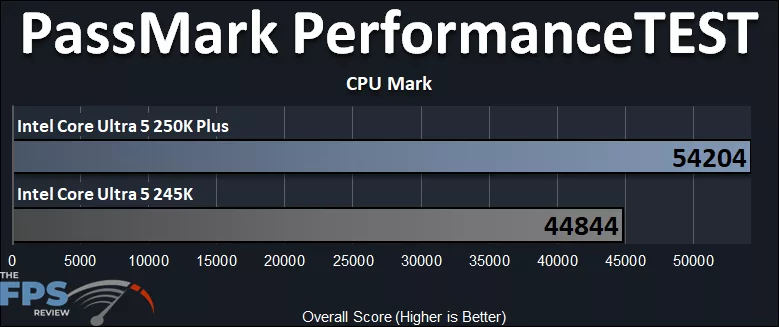
In the PassMark PerformanceTEST CPU Mark benchmark, the Intel Core Ultra 5 250K Plus is 21% faster than the Intel Core Ultra 5 245K. This again backs up the potential the Intel Core Ultra 5 250K Plus has over the Intel Core Ultra 5 245K when it comes to, well, everything. It’s very fast.
Discussion
Join Discussion →No replies yet. Be the first to reply on the forum.