
Gaming Performance (Al-Cl)
Take note that we will be breaking up the performance graphs for each game into separate “Native Resolution,” and “Upscaling,” and “Ray Tracing + Upscaling” graphs. That is, instead of typically having native resolution and upscaling compared on the same graph, now each graph is either native resolution or upscaling and ray tracing, standing alone. In this way, we can show you both the AVG FPS and the 1% Low performance of each video card, both at Native Resolution and at Upscaling, in separate graphs. We will also have the Ray Tracing + Upscaling graph included under each game as well. This means each game will have several graphs, and there will be a lot of graphs on each page in total to scroll through across multiple pages.
For all of our game testing, we are testing at 1440p resolution. We will test with a combination of Native Resolution and Upscaling. When using Upscaling, we are either using DLSS for NVIDIA or FSR for AMD. We have FSR 4/4.1 enabled where supported in games. The video cards being compared are all AIB video cards, except for the GeForce RTX 5070, which is a Founders Edition. Some have a factory OC, except the XFX Swift Radeon RX 9070 GRE Triple Fan Gaming Edition. The video card models and VRAM capacity are listed in the graphs. We have sorted the graphs from fastest to slowest. All games use manual run-throughs for benchmarking. Keep in mind that some games have Ray Tracing built into the game/engine, and always on, while others do not.
Alan Wake 2
Native Resolution
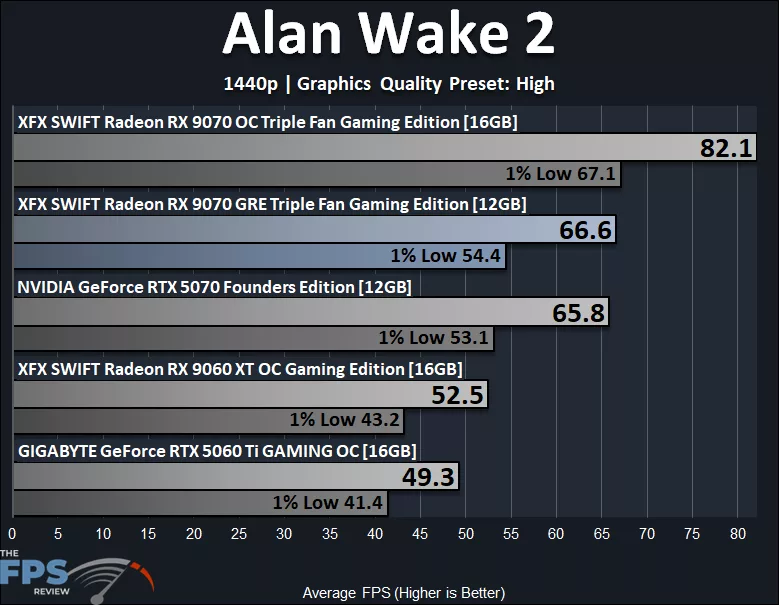
In this graph above, we have Alan Wake 2 at 1440p Native Resolution at “High” game settings. We can see that the AMD Radeon RX 9070 GRE does quite well, producing a very playable gameplay experience at 66.6 FPS AVG, and is as fast as the GeForce RTX 5070 in this game. The 1% Lows are at 54.4 FPS and therefore maintain a playable and smooth gaming experience in this game at 1440p Native Resolution. At this performance level of 1% Lows, the Radeon RX 9070 GRE is faster than the Radeon RX 9060 XT 16GB and GeForce RTX 5060 Ti 16GB video cards, and on 1% Lows, it is 19% slower than the Radeon RX 9070 OC video card. The 12GB of VRAM is not hindering this video card at Native Resolution in Alan Wake 2.
Upscaling
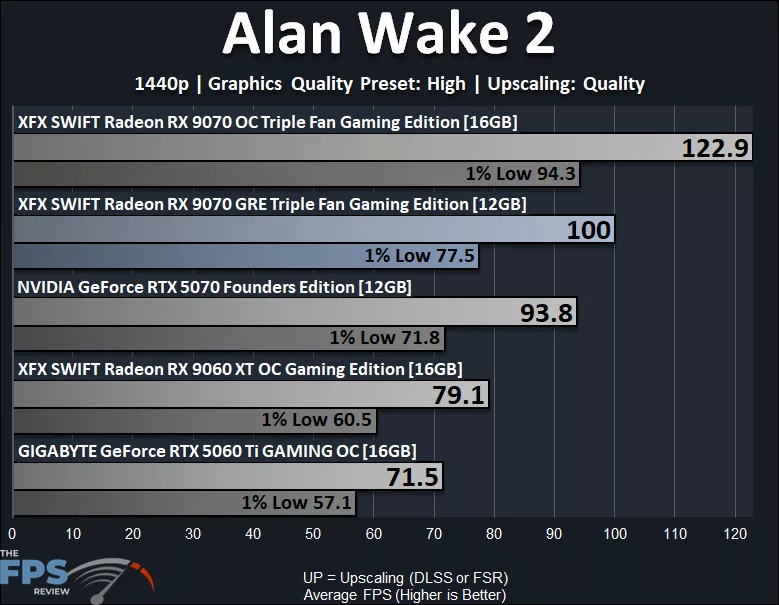
When we enable Upscaling, performance goes way up; the Radeon RX 9070 GRE averages 100 FPS, and the 1% Lows are a very high 77.5 FPS. With Upscaling, in this game, the Radeon RX 9070 GRE is actually faster than the GeForce RTX 5070 by 7% on AVG and 8% faster in 1% Low performance. The 12GB VRAM is not hindering the video card in this game with Upscaling.
Ray Tracing
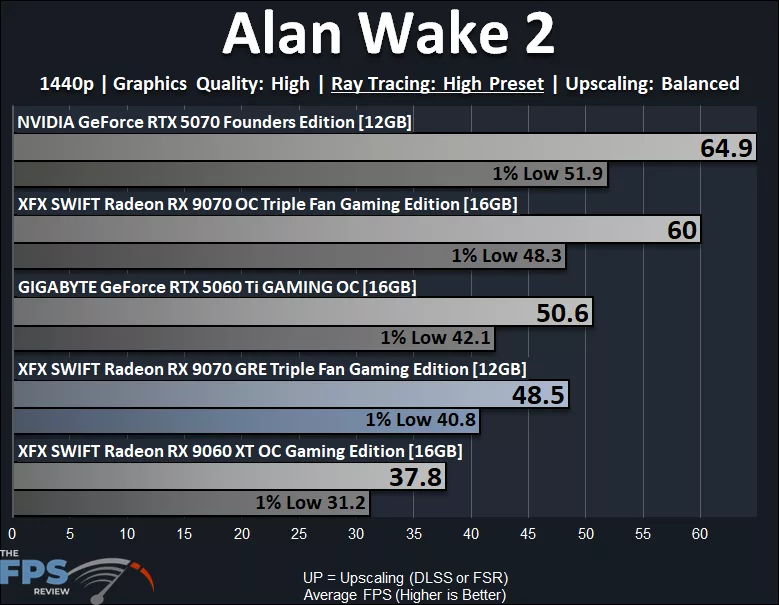
Now we have enabled “High” Ray Tracing in Alan Wake 2 at 1440p with FSR Upscaling enabled at Quality. The Radeon RX 9070 GRE takes a big hit with Ray Tracing. We can see that it is 28% faster than the Radeon RX 9060 XT, but it is 19% slower than the Radeon RX 9070 OC. It is close, though to the GeForce RTX 5060 Ti with the RTX 5060 Ti slightly edging out faster. The GeForce RTX 5070 runs away with the performance lead, though. On the 1% Low performance, at 40.8 FPS, the Radeon RX 9070 GRE doesn’t seem to be VRAM bottlenecking here, so it is not technically being held back by the 12GB of VRAM. Rather, it is just the Ray Tracing performance in this game holding it back. The GeForce RTX 5070 also has 12GB of VRAM, and it maintains 51.9 FPS for 1% Lows with Ray Tracing enabled, and is the fastest GPU here.
Battlefield 6
Native Resolution
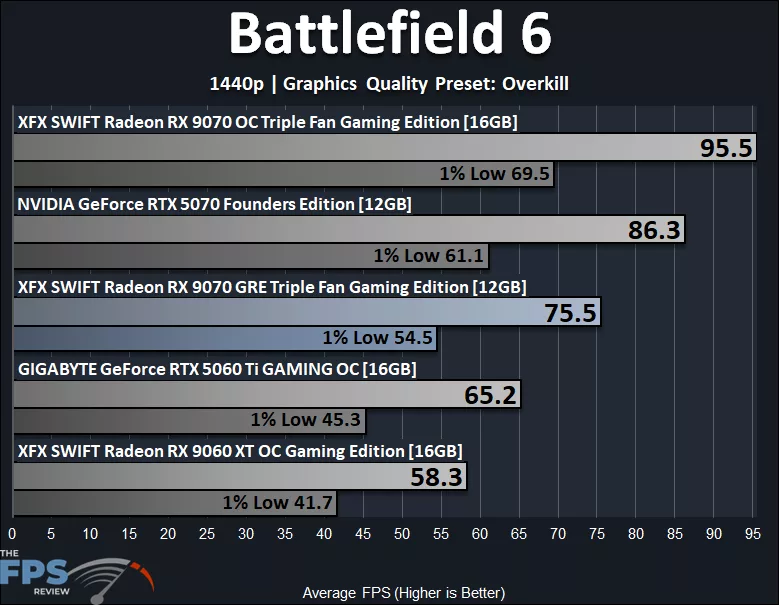
In Battlefield 6, we are running the highest game quality setting of “Overkill” at 1440p. At Native Resolution 1440p, the Radeon RX 9070 GRE is playable at 75.5 FPS AVG. It is faster than the GeForce RTX 5060 Ti and Radeon RX 9060 XT, but it is 13% slower than the GeForce RTX 5070 and 21% slower than the Radeon RX 9070 OC. In terms of 1% Lows, the Radeon RX 9070 GRE cannot break 60 FPS, but it is faster than the two slower 16GB video cards, so it seems VRAM capacity is not holding the performance back. At 54.5 FPS 1% Low, the Radeon RX 9070 GRE is 10% slower than the GeForce RTX 5070 and 22% slower than the Radeon RX 9070 OC.
Upscaling
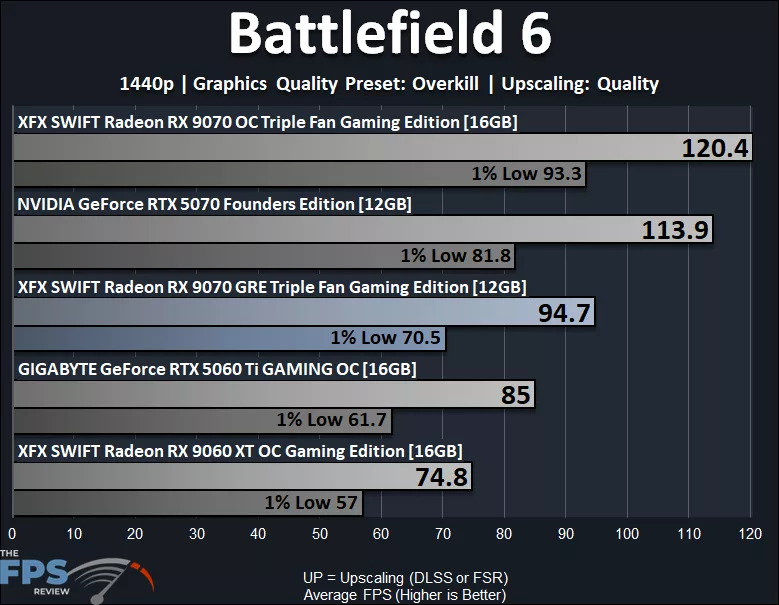
When we enable FSR Upscaling, the Radeon RX 9070 GRE gets a good bump in performance up to 94.7 FPS at 1440p, and the gameplay is very smooth. Now the 1% Low is above 60 FPS, up at 70.5 FPS, and we don’t see VRAM holding it back. It is still slower than the GeForce RTX 5070, but faster than the RTX 5060 Ti and RX 9060 XT. With Upscaling, the Radeon RX 9070 GRE is 14% slower than the GeForce RTX 5070 on 1% Low and 24% behind the Radeon RX 9070 OC on 1% Low.
Black Myth: Wukong
Native Resolution
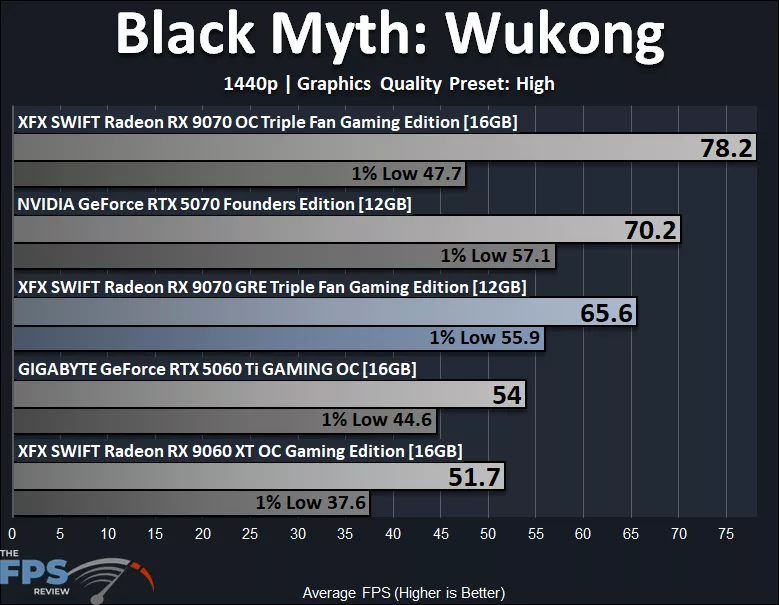
Black Myth: Wukong is a very GPU-heavy game, and so for this one we did have to drop down to “High” quality preset at 1440p in order to find a playable gameplay experience on the Radeon RX 9070 GRE. At this game setting, we can get above 60 FPS AVG, and the 1% Low is also acceptable at nearly 56 FPS with no signs of being bottlenecked. On AVG FPS the Radeon RX 9070 GRE is 7% slower than the GeForce RTX 5070 and 16% slower than the Radeon RX 9070 OC. On 1% Low, the Radeon RX 9070 GRE is only 2% behind the GeForce RTX 5070, and for some reason, it’s the Radeon RX 9070 OC that suffers here, oddly, despite it having more VRAM. Likely a bug or some other game issue.
Upscaling
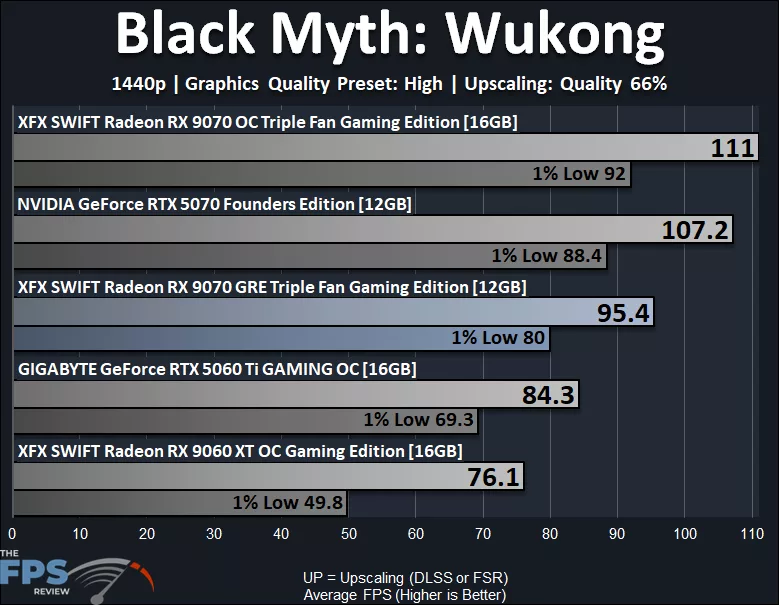
Now that we have enabled FSR Upscaling in Black Myth: Wukong, the AMD Radeon RX 9070 GRE performs extremely well at 1440p on “High” quality settings. We are getting AVG FPS of 95, and the 1% Lows are 80 FPS, so the game is super smooth. At this performance level, the Radeon RX 9070 GRE is 11% slower than the GeForce RTX 5070 and 14% slower than the Radeon RX 9070 OC. On 1% lows, the Radeon RX 9070 GRE is only 10% behind the GeForce RTX 5070 (with the same 12GB capacity) and 13% behind the Radeon RX 9070 OC.
Ray Tracing
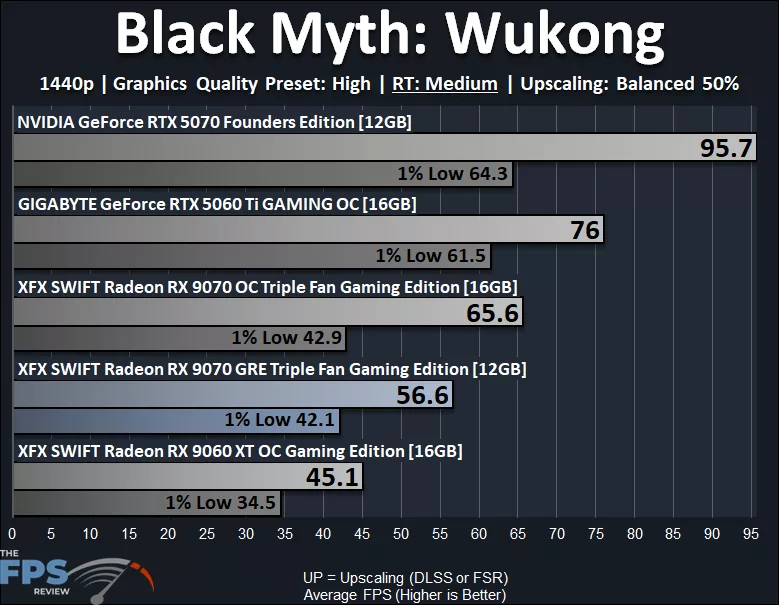
Enabling Ray Tracing is quite a drain on performance in this game, so we are using just “Medium” RT here. Even with FSR Upscaling enabled at Balanced 50%, the Radeon RX 9070 GRE is really not very playable, not reaching 60 FPS AVG, and the 1% Lows are in the lower 40s. It is faster than the Radeon RX 9060 XT by a lot, but here the GeForce RTX 5060 Ti 16GB beats it because the RTX cards handle Ray Tracing in this game a lot better; in fact, the RTX 5070 is beating the RX 9070 OC even. Therefore, the Radeon RX 9070 GRE is 14% behind the Radeon RX 9070 OC, 26% behind the RTX 5060 Ti, and 41% behind the RTX 5070. The 1% Lows match the same performance as the 16GB Radeon RX 9070 OC, so VRAM capacity isn’t holding it back here.
Cinematic Quality
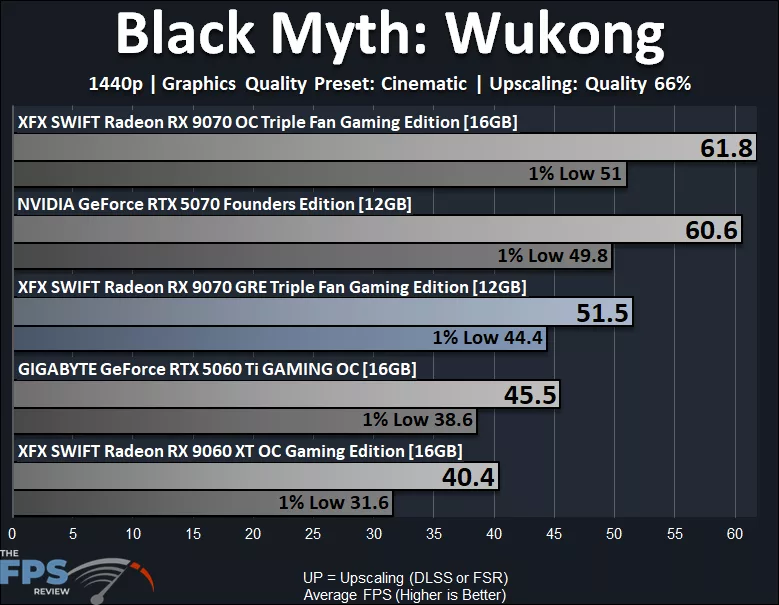
We wanted to see what performance looks like at 1440p with the game’s highest “Cinematic” image quality enabled, to really test out the VRAM capacity and 1% Lows. However, performance is so slow that we must also enable FSR Upscaling. At this setting, we can see that the game is not playable, even with FSR Quality Upscaling at Cinematic quality on the Radeon RX 9070 GRE. However, it is faster than the RTX 5060 Ti and RX 9060 XT 16GB video cards on 1% Lows. The Radeon RX 9070 GRE is 15% behind the RTX 5070 and 17% behind the RX 9070 OC. The 1% Lows are 11% behind the RTX 5070 and 13% behind the RX 9070 OC, a 16GB video card.
Clair Obscur: Expedition 33
Native Resolution
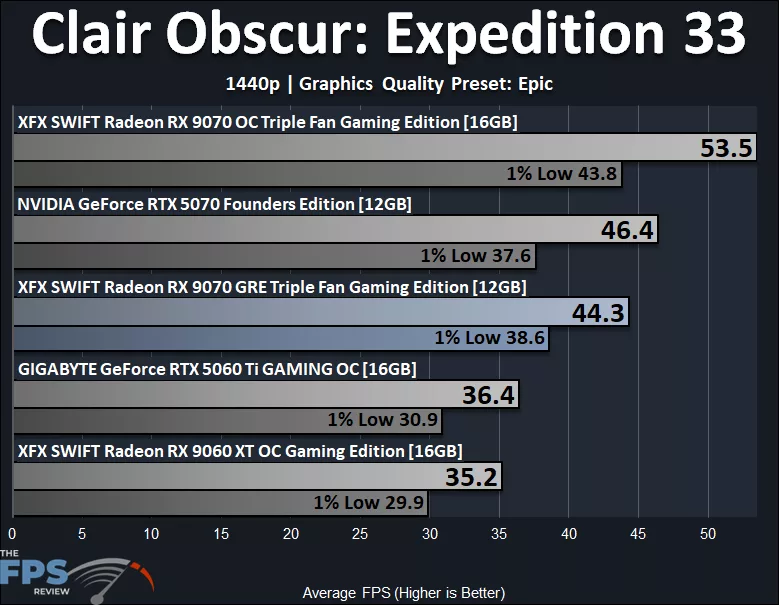
In Clair Obscur: Expedition 33, we have set the game to its highest in-game quality setting of “Epic” to stress the VRAM here at Native Resolution 1440p. At this setting, the game isn’t playable; the video cards just aren’t powerful enough without upscaling or lowering game settings. The Radeon RX 9070 GRE is close to the GeForce RTX 5070 performance, only 5% slower on average. However, look at the 1% Lows; they are actually slightly higher than the GeForce RTX 5070 at a 3% advantage. The Radeon RX 9070 GRE is 17% slower than the Radeon RX 9070 OC on average and on the 1% Lows 12% slower.
Upscaling
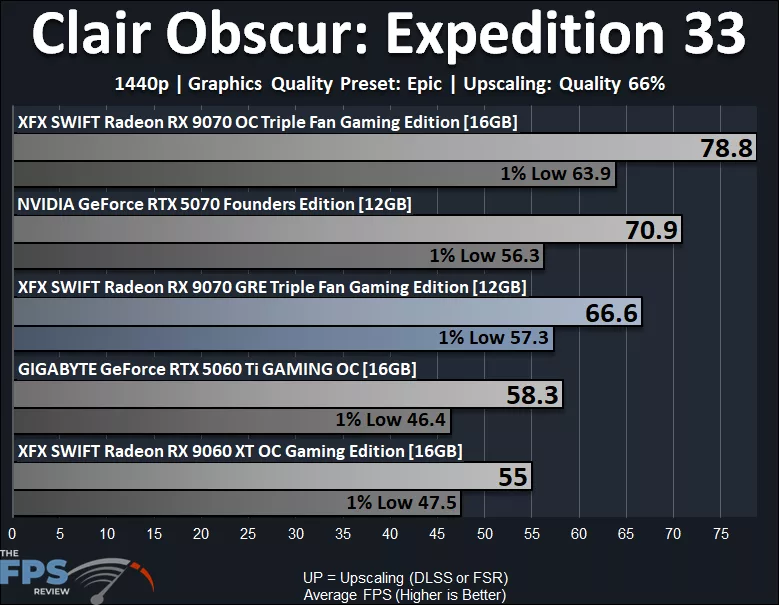
Enabling FSR Upscaling at 1440p makes this game playable on the Radeon RX 9070 GRE at Epic quality settings, averaging 66 FPS AVG. We don’t see any issues with the 1% Lows either; they don’t seem bottlenecked at these settings for this game. The Radeon RX 9070 GRE is 6% slower than the RTX 5070 on average and 15% slower than the RX 9070 OC on average. The 1% Lows are actually 2% faster on the Radeon RX 9070 GRE compared to the RTX 5070 and 10% slower than the Radeon RX 9070 GRE.
High Preset Native Resolution
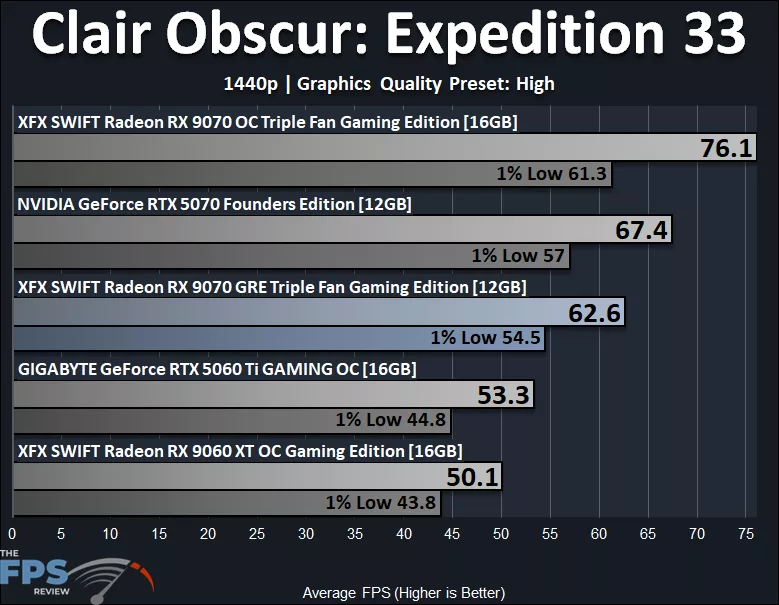
Since the Epic quality preset was so slow at Native Resolution 1440p, we decided to also try the “High” setting at Native Resolution 1440p. At “High” settings and without upscaling, the game is playable on the Radeon RX 9070 GRE, averaging over 60 FPS. The 1% Lows look good as well here. The Radeon RX 9070 GRE is only slightly behind the GeForce RTX 5070, 7% on AVG and 4% on 1% Lows. The RX 9070 GRE is 18% behind the RX 9070 OC on AVG and 11% on 1% Lows.
Discussion
Join Discussion →No replies yet. Be the first to reply on the forum.