
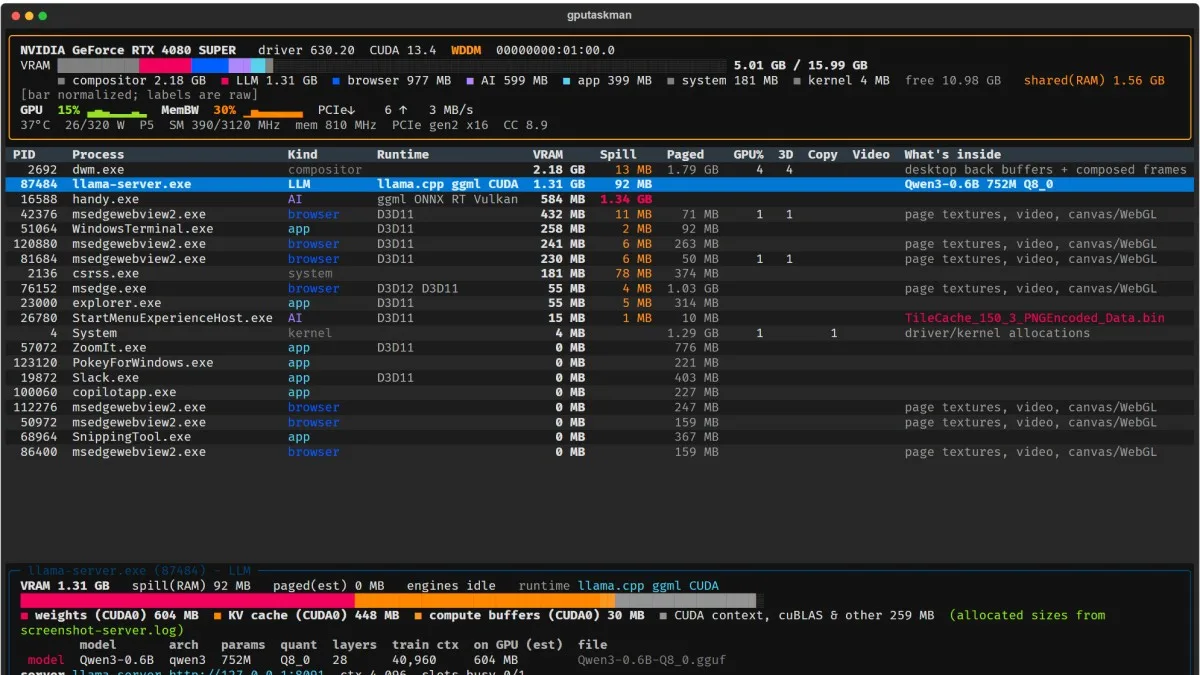
A new free app called GPU Taskman is giving users the opportunity to see what’s consuming VRAM and every process accessing a system’s GPU. Graphics card monitoring software is nothing new, but over the decades has largely fallen into a rut in just offering a similar set of features such as clock rates, cooling profiles, power usage, and associated metrics, and despite some having added new hot spot or junction point monitoring, not much has changed. GPU Taskman, as the name implies, takes a different approach by somewhat mimicking Windows Task Manager, thus giving users a different perspective on how the graphics card is being used. Microsoft VP Scott Hanselman has posted about the new app, stating that it can give a much more granular insight into GPU and VRAM usage.
“Task Manager says “15 GB used.” This tries to answer: by what? Model weights? KV cache? Your browser? The desktop compositor? And why is so much GPU memory in system RAM?“
– Scott Hanselman, Microsoft VP
There’s a lot going on in my GPU. I’m making a GPU Taskman to get insights to where my GPU memory is going. PRs welcome https://t.co/6FwKqnFWDW
— Scott Hanselman 🌮 (@shanselman) November 3, 2026
As reported by Tom’s Hardware, the tool is still in early stages but currently up to v0.3.0. GPU Taskman is available on GitHub and works on Windows, macOS with Python 3.1, and Linux/WSL for NVIDIA or AMD GPUs. While the app is still being worked on, there’s a rumor it may eventually get integrated into Windows. In the meantime, this lightweight app, also available for Windows Mobile, is a nifty way to check on how AI models and other tasks are utilizing your GPU’s resources.
Scope: local GPU workloads, not cloud services
- Decision models, vision, speech, LLM inference, training/fine-tuning (including Unsloth), graphics, and video all belong here.
- Visibility varies: process memory and engine activity are measured; identifying individual models and their work requires supporting evidence.
- A PyTorch/CUDA DLL alone cannot identify a model or prove training, and a mapped file does not prove that the model is resident on the GPU or being exercised.
- CPU-only, NPU-only, and cloud workloads are out of scope.
Discussion
Join Discussion →No replies yet. Be the first to reply on the forum.