Power and Temperature and Frequency
On this page, we are going to investigate the Intel Core i9-14900K power draw, temperature, and frequency. This is a stress test, which means we are pushing each CPU to its maximum potential in all-core load in the Cinebench R23 multi-core test for 10 minutes.
Power
We use HWiNFO64 sensor data to record the results. We report on the sensor data for “Package Power” in Wattage.
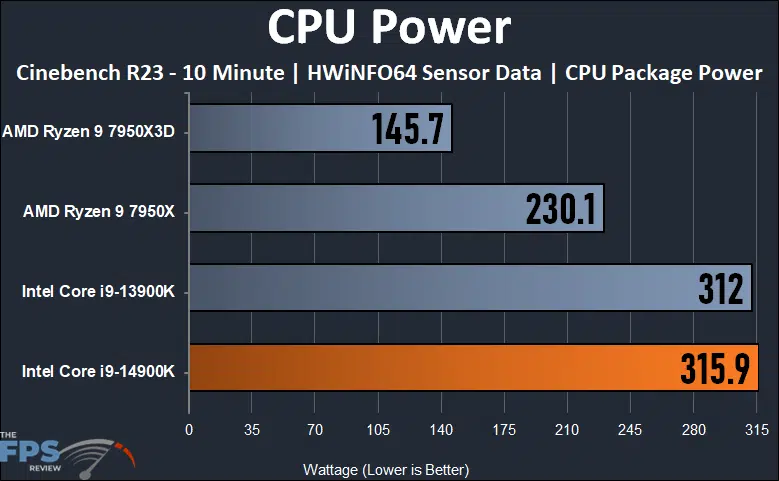
So this graph shows the rub. If there is one catch about the Intel Core i9-14900K’s performance, it is this graph right here, power draw. Pushing all cores, the Intel Core i9-14900K burns through at 315.9W peak power draw. This is higher than the Intel Core i9-13900K by 1.25% or 4W.
Keep in mind that we are running the motherboard at PL1 and PL2 of 4,095W because we have the 360mm AIO setting enabled in the BIOS, which the motherboard auto-detected for us and set by default. You could clamp this power draw by utilizing Intel Defaults, instead of Motherboard Defaults, and of course, doing so will keep the power draw down. This power draw takes into account thermal capabilities and runs the CPU as hard as it can until it thermally throttles or hits its thermal limits. If we had a lesser AIO, it would hit the limits sooner, and performance would be lower. Performance and power are going to be determined by your cooling, and power settings here in the BIOS. We are again using the motherboard DEFAULTS with our 360mm AIO, but we are using this same testing scenario on all CPUs.
When we compare power to the Ryzen 9 7950X the Intel Core i9-14900K uses 37% more power. When we compare power to the Ryzen 9 7950X3D the Intel Core i9-14900K uses 117% more power. By far, the Ryzen 9 7950X3D is the most power efficient of the lot and produces very nearly the same synthetic benchmark performance, but also comparable gaming performance. It’s the right choice when power is your driving factor.
Temperature
We use HWiNFO64 sensor data to record the results. We report on the sensor data for “Tcidle” in Celsius.
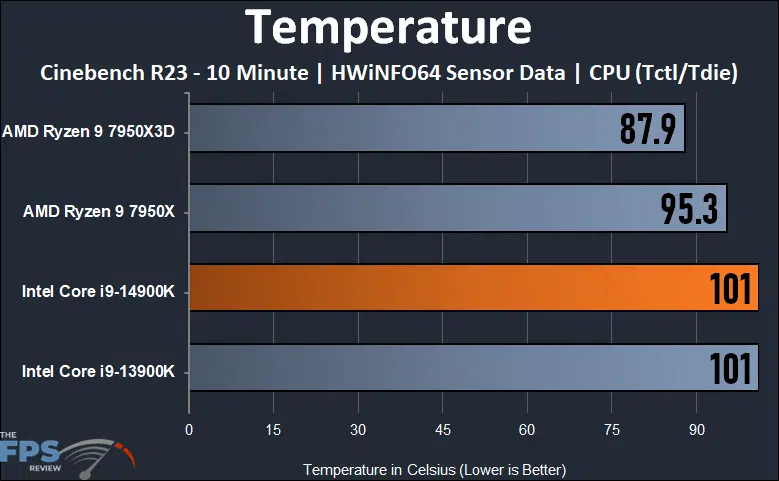
With great power, comes great respon….err HEAT! Yes, that’s right, Intel Core i9-13900K and 14900K are hitting their thermal limits at 100/101c. It’s all the wall here, nothing left on the table, they are being pushed to their limits, and those thermal limits are throttling the chips at this power level with this cooling level. The Ryzen 9 7950X still gets toasty too, but still shies away from the 100c mark. The Ryzen 9 7950X3D is the coolest at under 90c.
Frequency
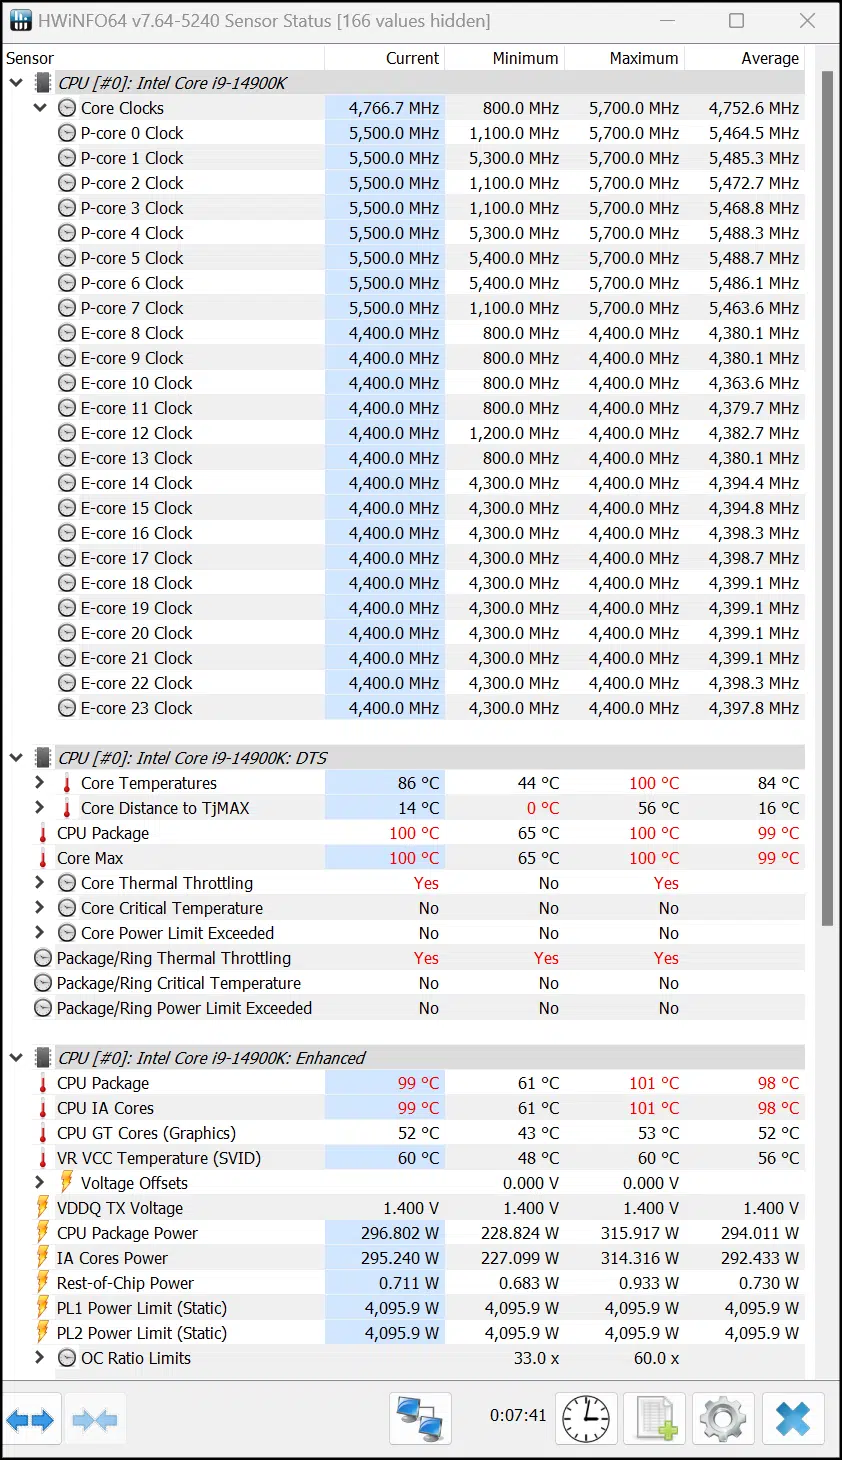
So how does this all affect the frequency on the Intel Core i9-14900K? When pushing all the cores (on the left) we see the frequency of the P-cores fluctuate between 5300MHz-5500MHz. Often times we saw 5400MHz, but definitely there were times it dropped to 5300MHz, and still times it was fine at 5500MHz, it seems to bop around that level. On the E-cores it stayed at 4400MHz all the time. This means that it actually runs below the P-core Max Turbo frequency on all-core workloads by up to 300MHz at times, but can hit about 100MHz below. It never hits that Turbo Boost Max frequency. The E-cores, however, remain at their Max Turbo Frequency.
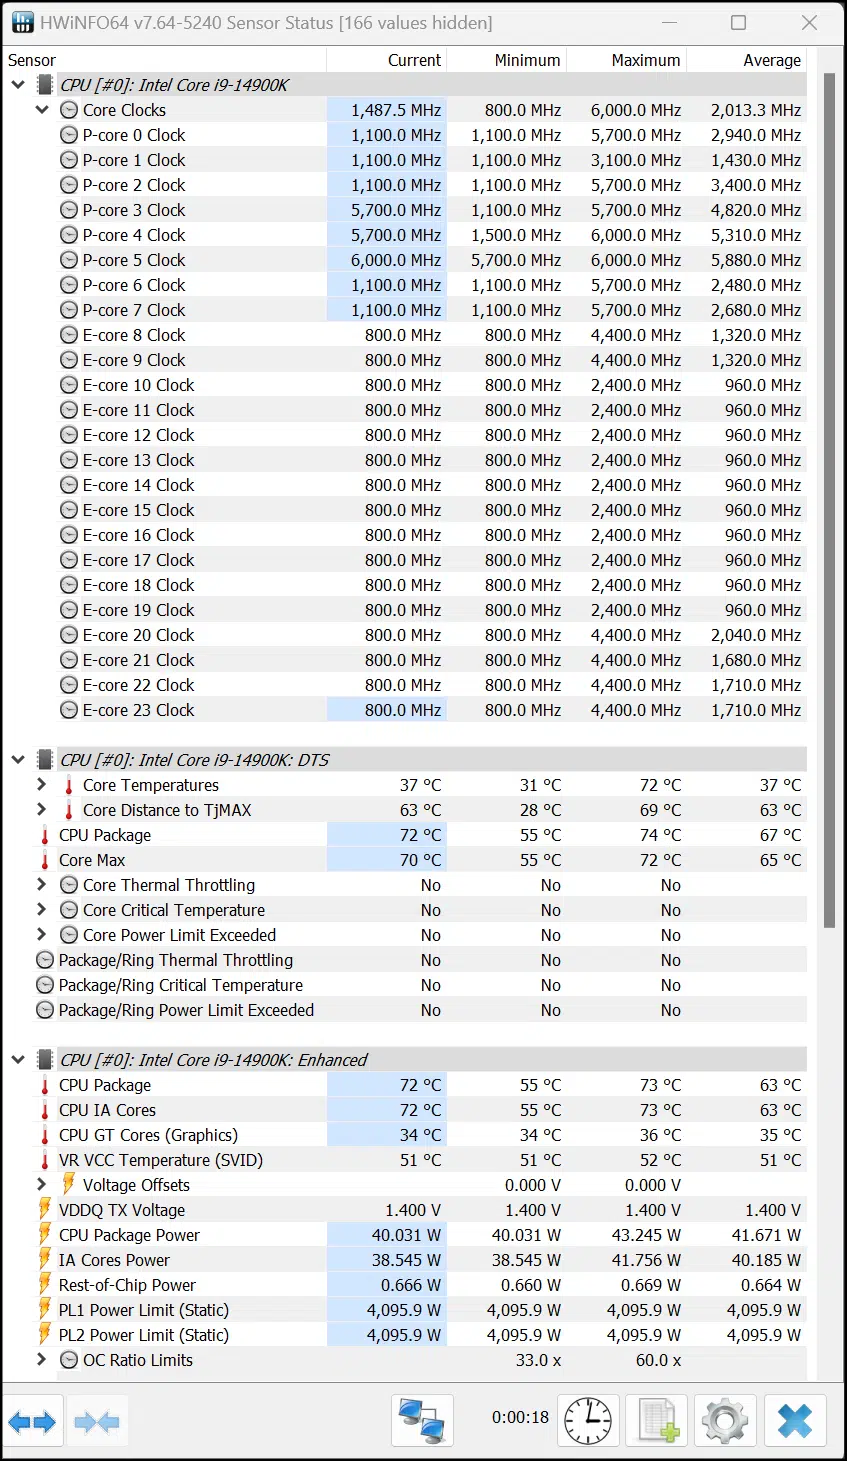
On single-core workloads (on the right) we do see that it is peaking at 6GHz on the P-cores for its Thermal Velocity Boost frequency.
Discussion (8 replies)
Join Discussion →Nice review. I didn't have really high hopes for this "refresh", but was thinking of maybe a 14700K, but now that just wouldn't make sense.
We have a 14700K in house - it should be on its way to Brent to get the review done (it was used on the launch motherboard review we did).
I ran benches on it for a few days and generally observed it to be on par or slightly faster than the 13900K except for some all core exercises like Cinebench while using the same amount of power.
That is good to hear, but from everything I have read here and have read everywhere else this 14th gen isn't worth the upgrade from my 13600K.
14th Gen was never intended to be an upgrade from 13th Gen.
It was known well ahead of time that it would be just a refresh with a clock speed bump. It's been called Raptor Lake refresh for ages. The results are expected. I don't know why everyone is so shocked.
A lot of people are overreacting for sure. I came in with an open mind that if one of these 14th gen processors were a worthy upgrade then I’d pull the trigger.
Yeah, we had a post about a month ago with the Intel's road map post refresh and by mid-end 24 to early 2025, things look kind of exciting. Panther Lake and the next socket design.
https://www.thefpsreview.com/2023/09/21/intel-confirms-arrow-lake-lunar-lake-and-panther-lake-processor-lineups-will-begin-launching-in-2024-and-into-2025/
Yep and right in line with the next CPU for AM5 right? should be a good time for CPU's, not so much for GPU's I'm thinking. Well 2025 maybe.
Yep, I will be waiting until next year to upgrade I believe. My 13600K is doing fine and should easily last me until then.