Synthetic System Benchmarks
On this page, we will show synthetic benchmarks, some that test a variety of system use-case scenarios, and others that test specific multi-core and single-core/thread workloads to hone in on performance differences.
3DMark CPU Profile
We are testing 3DMark’s CPU Profile, which tests Thread performance and Single Thread performance; we are reporting both on separate graphs. We can customize the number of threads tested, and have done so to isolate differences.
Max Threads
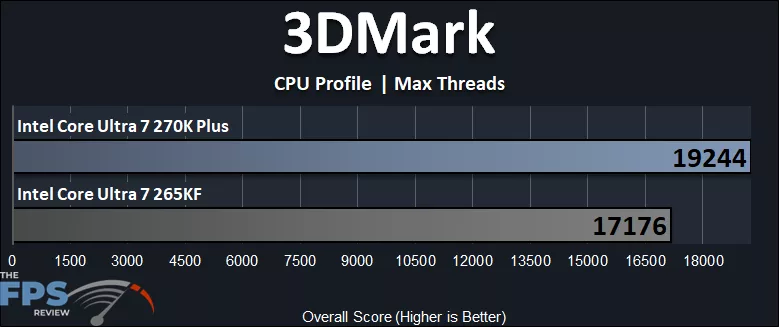
In 3DMark CPU Profile, we have started by setting the test to “Max Threads”, which should show the advantage the Intel Core Ultra 7 270K Plus has over the Intel Core Ultra 7 265K since it has 24 total threads compared to 20. Indeed, we can see that the new Core Ultra 7 270K Plus is 12% faster in Max Threads performance compared to the Core Ultra 7 265K.
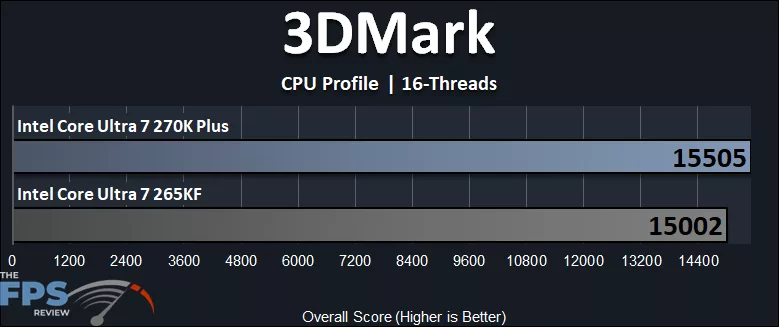
We can customize the settings and now set 16 Threads, so that each now is not advantaged by the number of cores. When the core count is equalized, we can see now that with the core count advantage gone, the performance is much closer between the CPUs in this multi-threaded application test. We see just a 3% bump in performance from the new Intel Core Ultra 7 270K Plus. While it is theoretically better, it’s not as advantageous when operating without the core count advantage.

Now we can really hone in more, by reducing the thread count down to 8, therefore putting all the workload on the 8 P-Cores between both CPUs, and seeing how the P-Cores differ in performance. As we can see, it’s still not that advantageous, technically, at just 4% faster on the Intel Core Ultra 7 270K Plus.
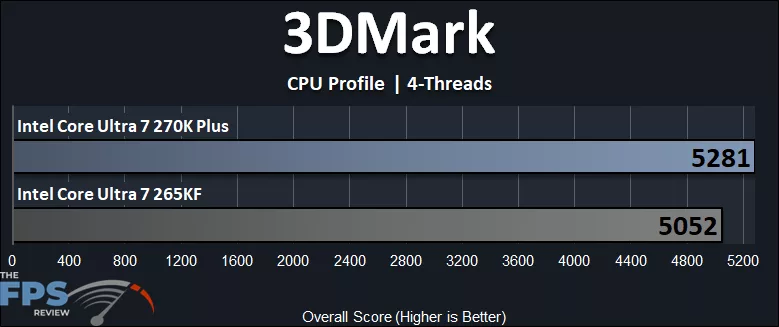
Moving down even further to just 4 Threads, we see the Intel Core Ultra 7 270K Plus has a 5% advantage in performance over the Intel Core Ultra 7 265K, again, not a lot, but technically higher yes.
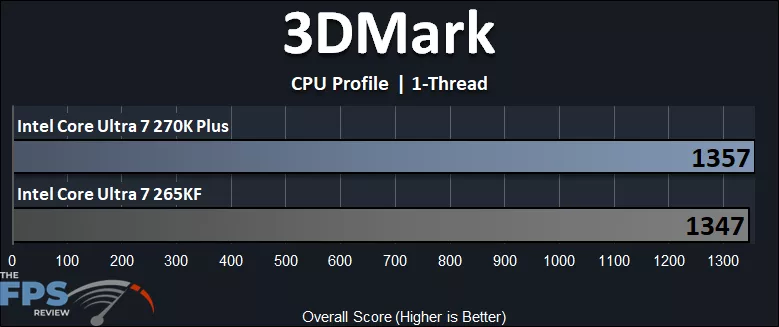
Now for the single-thread or 1 Thread performance testing. Here we see that the performance difference is not even 1% of a difference between the CPUs when it comes to single-thread or IPC performance.
Geekbench 6.7
Geekbench has had an interesting development with the Intel Core Ultra 200S Plus series CPUs as it relates to the Intel Binary Optimization Tool. You can read all about it here, where it goes into detail. Therefore, we are using the newly released Geekbench 6.7 version for all of our testing today. We will show Multi-Core (nT) and Single-Core (1T) performance in separate graphs.
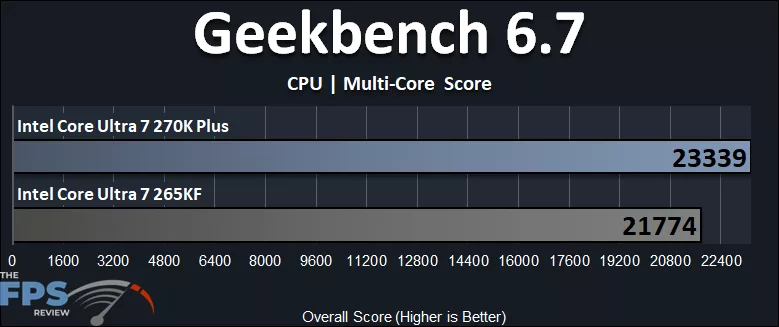
In Geekbench 6.7, the Intel Core Ultra 7 270K Plus is 7% faster than the Intel Core Ultra 7 265K in the Multi-Core Score. That is not as much as we saw in the 3DMark Max Threads test, but this test in Geekbench is more generalized to different workloads, while the 3DMark test is much more specific to a single workload type, really showing the maximum potential.
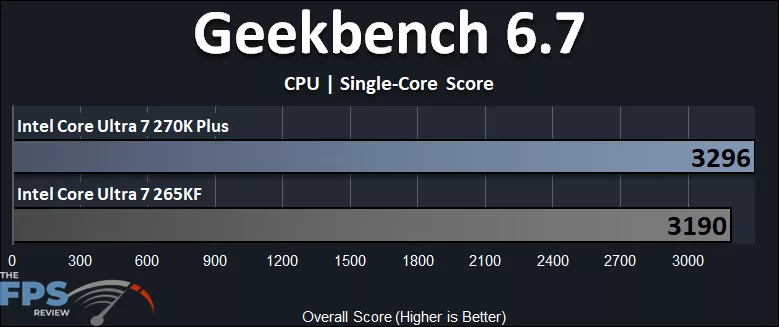
When it comes to the Single-Core score, Geekbench 6.7 reveals that the Intel Core Ultra 7 270K Plus is 3% faster than the Intel Core Ultra 7 265K.
PassMark PerformanceTEST
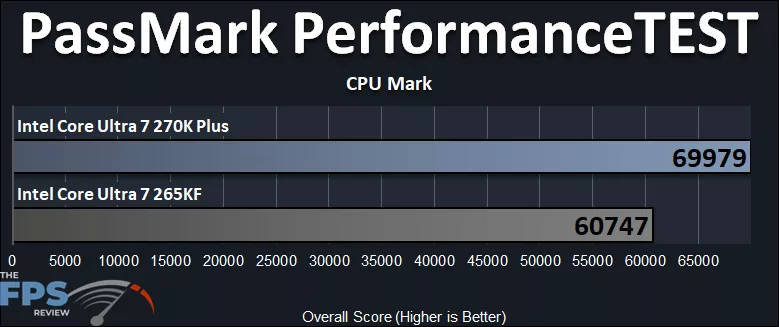
In PassMark PerformanceTEST CPU Mark benchmark, the Intel Core Ultra 7 270K Plus is 15% faster than the Intel Core Ultra 7 265K. This is more in line with the all-core count difference being reflected when utilized.
Discussion (7 replies)
Join Discussion →What's disgusting is that prices are already over 50% markup on these.
Yeah, I was noticing that. I'm hoping it comes down. But I'm also not surprised.
Any memory latency tests done?? Are they lower than the initial released procs? Best I can get my 265KF to is 70.1ms per aida64.
I haven't tested it, but I will be doing some DDR5 memory performance comparisons with different speed DDR5 for an upcoming memory comparison review, and I'll make sure to check out the latency in that testing.
I just did a quick test with the 270K Plus with 7600 MT/s DDR5 I'm using, CL38-46-46-105 CR2 - AIDA64 reports 81ns
I'll be doing more testing, and have a different kit I'll be comparing with, just wanted to share with you what I got on this system at the moment.
Should be able to tweek that down even more with NPU and Core to Core overclocking. Thank you as well!
That's a good stock result given the hardware configuration (separate memory controller and CPU dies).