Power and Temperature Testing
On this page, we are going to investigate the Intel Core Ultra 7 270K Plus power draw, temperature, and clock speeds. We are going to do this two ways. First, we are going to test while playing a game, under a gaming workload, and then we are going to test under a multi-threading Cinebench 2026 workload. In this way, we can get a feel for the gaming power and temp versus “all core” power and temp. CPU package power and temps are read with HWiNFO64.
Power Testing While Gaming
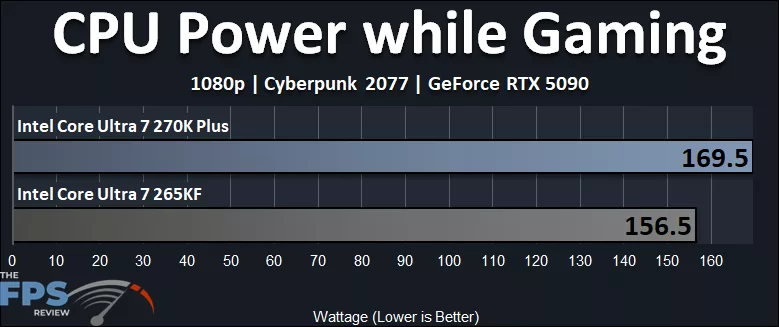
In the graph above, the Intel Core Ultra 7 270K Plus peaked at 169.5W, while the Intel Core Ultra 7 265KF peaked at 156.5W. This means the Intel Core Ultra 7 270K Plus is pulling about 13W or 8% more power while gaming compared to the Intel Core Ultra 7 265KF. In this particular game, the Intel Core Ultra 7 270K Plus was 6% faster than the Intel Core Ultra 7 265K, so it takes a little bit more power to achieve the percentage increase; it isn’t quite linear, a little less efficient, but close-ish.
Power Testing Multi-Threading
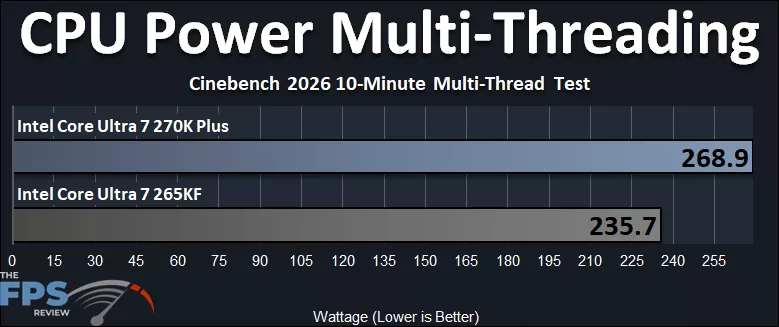
When pushing all-core Wattage, the Intel Core Ultra 7 270K Plus pulls 268.9W, while the Intel Core Ultra 7 265KF pulls 235.7W. This reflects the increased core count with 4 extra E-Cores present on the Intel Core Ultra 7 270K Plus, demanding much more power when in use with 24 threads. The Intel Core Ultra 7 270K Plus, therefore, can use up to 33W or 14% more power in Multi-Threaded applications. Remember, the max Turbo Power is 250W, so the Intel Core Ultra 7 270K Plus is exceeding it on this motherboard, at Default settings.
Temperature Testing While Gaming
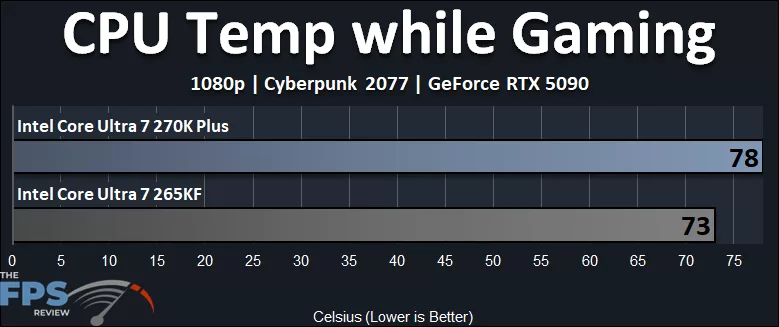
The Intel Core Ultra 7 270K Plus runs about 5 degrees warmer while gaming, compared to the Intel Core Ultra 7 265KF. It was pulling about 8% more power, and we do see that this, plus the frequency increases, increases the temperature by 7% while gaming.
Temperature Testing Multi-Threading
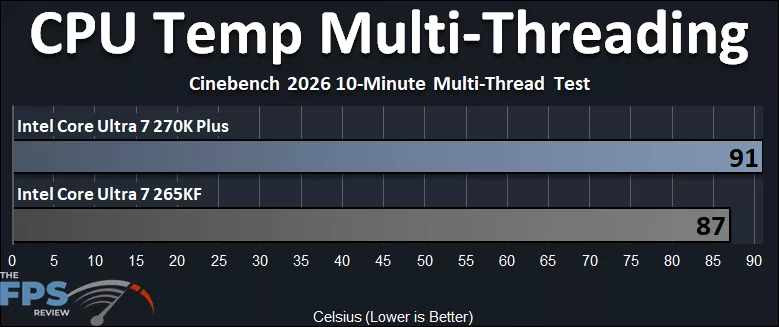
There is definitely an increase in temperature when all cores are active in Multi-Threading. The Intel Core Ultra 7 270K Plus runs 4 degrees warmer, or 5% warmer, reaching above 90c. Considering the larger 14% power increase, it’s actually a bit impressive that the temperature isn’t running even hotter than this. Naturally, cooling will depend on your cooling configuration; we are using a 360mm AIO.
Intel Core Ultra 7 270K Plus HWiNFO64 Sensor Data
We wanted to show the full HWiNFO64 Sensor Data for both the Intel Core Ultra 7 270K Plus and Intel Core Ultra 7 265KF in our gaming workload, playing a game (left screenshot) and the Multi-Threaded Cinebench 2026 All Core workload (right screenshot), so you can compare the CPUs and clock speeds.
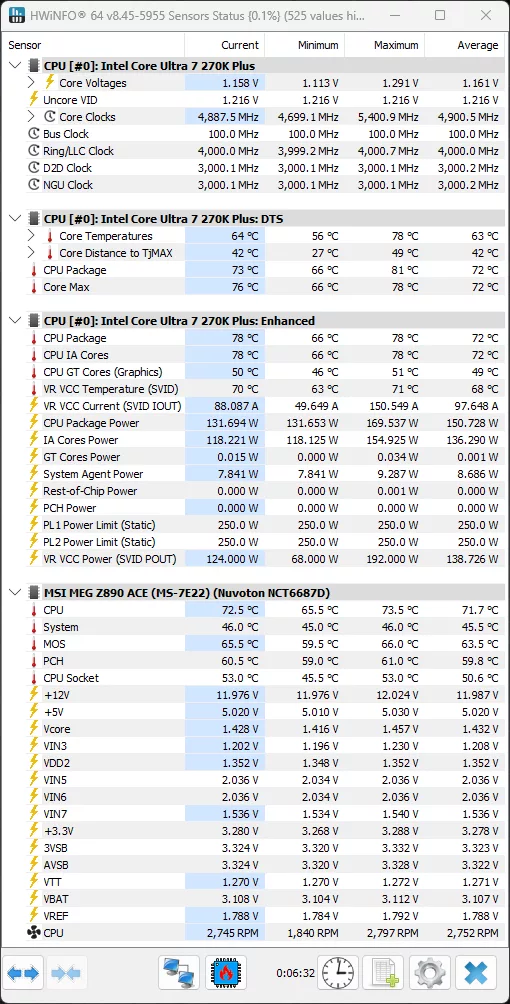
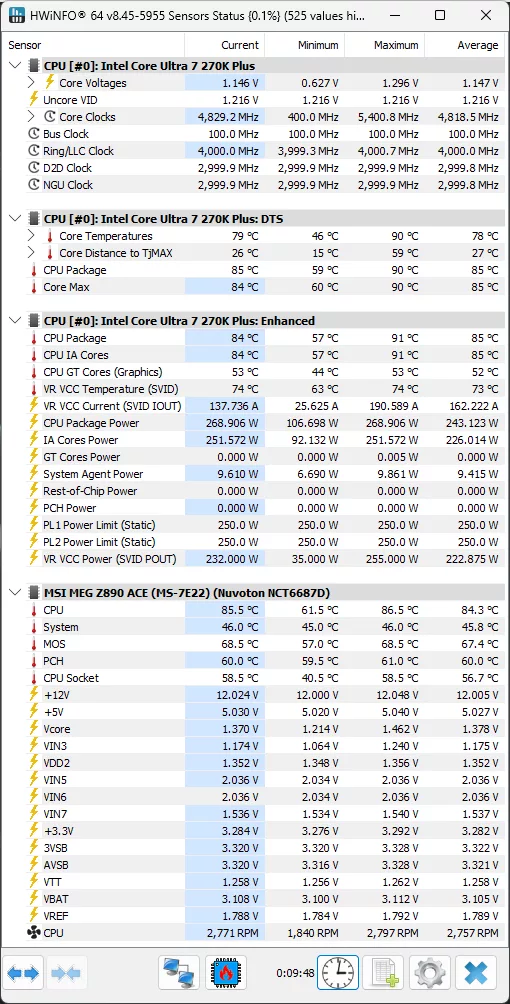
The Intel Core Ultra 7 270K Plus runs up to a maximum of 5.4GHz while gaming, but the average was 4.9GHz while gaming, with the current frequency while in-game at 4.887GHz. You can see how this compares to the 265KF below. We can also see that in the Multi-Threading workload, the Intel Core Ultra 7 270K Plus can operate up to 5.4GHz, averaging 4.8GHz, and snapped while mid-workload current was 4.829GHz. You can also see that the Ring/LLC Clock is at 4GHz, the D2D Clock at 3GHz, and the NGU Clock at 3GHz.
Intel Core Ultra 7 265KF HWiNFO64 Sensor Data
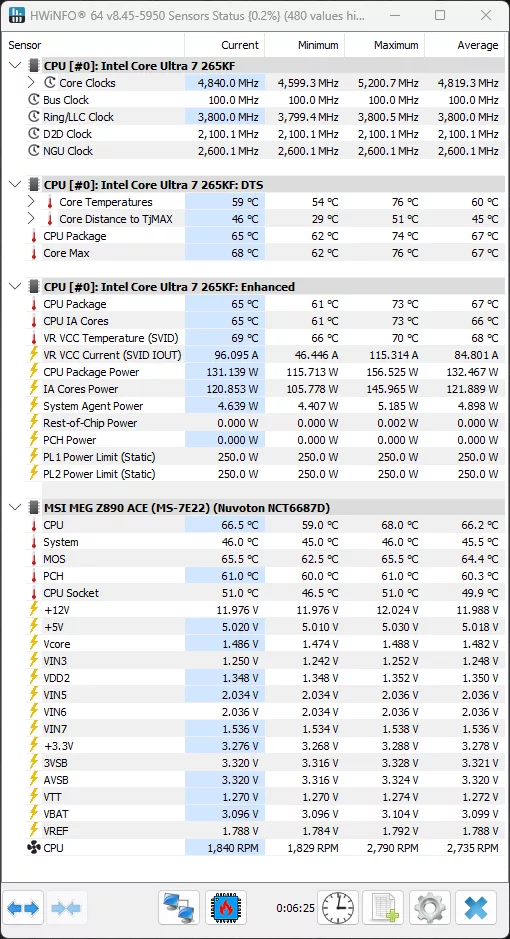
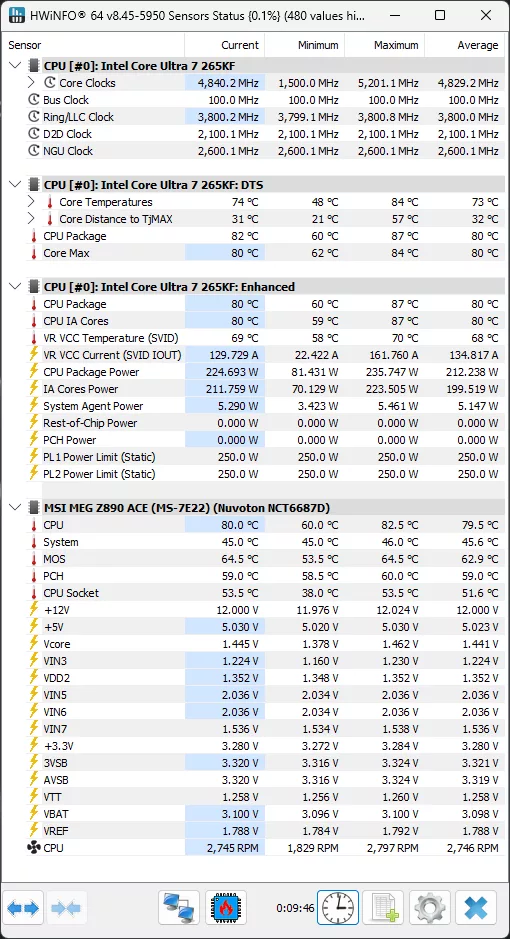
The Intel Core Ultra 7 265KF runs up to a maximum of 5.2GHz while gaming, but the average was 4.8GHz while gaming, with the current frequency while in-game at 4.840GHz. You can see how this compares to the 270K Plus above. We can also see that in the Multi-Threading workload, the Intel Core Ultra 7 265KF can operate up to 5.2GHz, averaging 4.8GHz, and snapped while mid-workload current was 4.840GHz. You can also see that the Ring/LLC Clock is at 3.8GHz, the D2D Clock at 2.1GHz, and the NGU Clock at 2.6GHz.
Discussion (7 replies)
Join Discussion →What's disgusting is that prices are already over 50% markup on these.
Yeah, I was noticing that. I'm hoping it comes down. But I'm also not surprised.
Any memory latency tests done?? Are they lower than the initial released procs? Best I can get my 265KF to is 70.1ms per aida64.
I haven't tested it, but I will be doing some DDR5 memory performance comparisons with different speed DDR5 for an upcoming memory comparison review, and I'll make sure to check out the latency in that testing.
I just did a quick test with the 270K Plus with 7600 MT/s DDR5 I'm using, CL38-46-46-105 CR2 - AIDA64 reports 81ns
I'll be doing more testing, and have a different kit I'll be comparing with, just wanted to share with you what I got on this system at the moment.
Should be able to tweek that down even more with NPU and Core to Core overclocking. Thank you as well!
That's a good stock result given the hardware configuration (separate memory controller and CPU dies).