OpenGL Performance
We had to check out the default OpenGL performance to compare it with the performance drop that path traced raytracing performance demand is upon Quake II RTX. Therefore, below you will find two graphs. The first graph shows performance on the ASUS ROG STRIX RTX 2080 Ti OC with the default OpenGL settings in the three demo runs at 4K, 1440p and 1080p. Then, the second graph shows performance on the MSI GeForce GTX 1080 Ti LIGHTNING Z with default OpenGL settings at 4K, 1440p, 1080p and 720p.
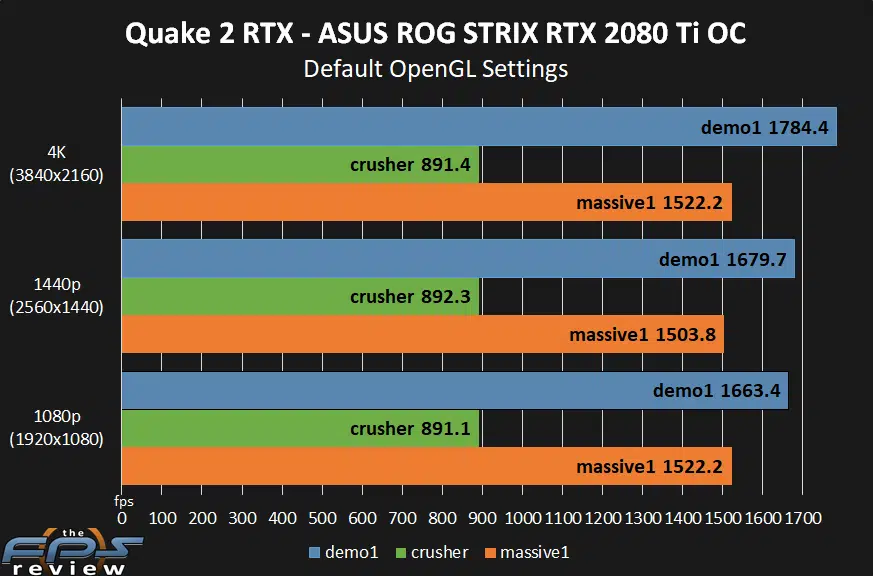
The results loudly speak to the performance burden path traced raytracing is in Quake II RTX. Performance in demo1 and massive1 are in the 1,000’s of FPS, that’s right, 1,784FPS in demo1 at 4K, and 1,522FPS in massive1. In fact, performance seems to get faster the higher the resolution. The answer for this? You are seeing extreme CPU limitations at the lower resolutions. With the higher resolutions the GPU can do more and hence performance actually goes up. This is a prime example of CPU bottlenecking in a very fast game where it’s just too easy for the GPU. The crusher demo is also very CPU bottlenecked as we can see, but still operating near 900FPS in OpenGL.
If we look back and try to do the math for demo1 at let’s say 1440p then OpenGL is 2,565% faster than path traced raytracing, or path traced raytracing takes a performance drop of 96%. Yeah, you get the idea.
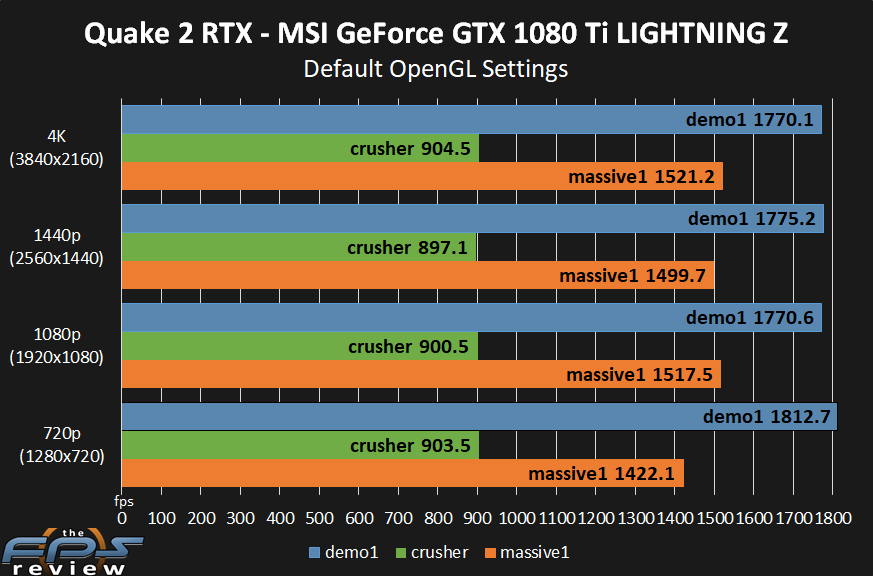
The same is true for the MSI GeForce GTX 1080 Ti LIGHTNING Z video card. Performance is crazy fast in OpenGL in this 22-year-old game. Turning on the path traced raytracing features of Quake II RTX renders this game very slow on the GTX 1080 Ti, it shows how much of a burden raytracing everything really is. It also shows that the RTX video cards do benefit with their RTX Cores and Tensor Cores.