Power and Temp
In the graph we are comparing total system Wattage at the wall, results are in Watts and the temperature is in Celsius at full-load.
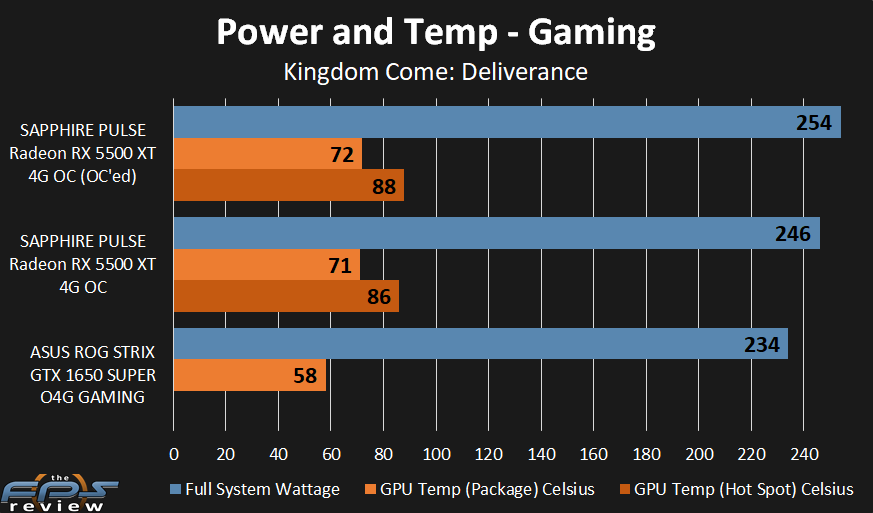
In this graph, the blue bar graph is the total system Wattage at full-load, peak, on each video card. The light orange bar represents the GPU Temperature at the edge of the package. The dark orange bar represents the special hot spot or hottest part of the die temperature reading in GPUz that the latest NAVI GPUs support.
From this graph, the first thing we notice is that the ASUS ROG STRIX GTX 1650 SUPER O4G GAMING is more efficient on power overall, hitting 234W max. The SAPPHIRE PULSE Radeon RX 5500 XT 4G OC hit 246W max. They honestly aren’t far apart, when gaming you wouldn’t really notice which one is eating more power if you weren’t looking. When we overclocked the Radeon RX 5500 XT it went up to 254W max. With Wattage generally under 250W total system Wattage we’d say both video cards are pretty good on power utilization.
In terms of temperature though, the Radeon RX 5500 XT seems to be putting out more heat, or at least not being cooled as good as it could. The GPU temperature was 71c versus 58c on the ASUS ROG STRIX GTX 1650 SUPER. That’s a pretty big difference. The GPUz hot spot temp was 86c and when overclocked 88c.
The cooling on the SAPPHIRE PULSE is overlarged and extends beyond the size of the PCB, there is extra heatsink area. The fans spin at a quiet rate. If they spun faster, perhaps the temperature would be cooler, but as they are now, they are very silent.
We don’t have other video cards to compare right now, so we can’t say whether this is good or bad. It may be a great temperature, or it may not. As we get other cards to compare then we can re-visit temperature and see what other cards look like compared to the SAPPHIRE PULSE. At any rate, the fans are very silent and won’t bother you.