PCMark 10
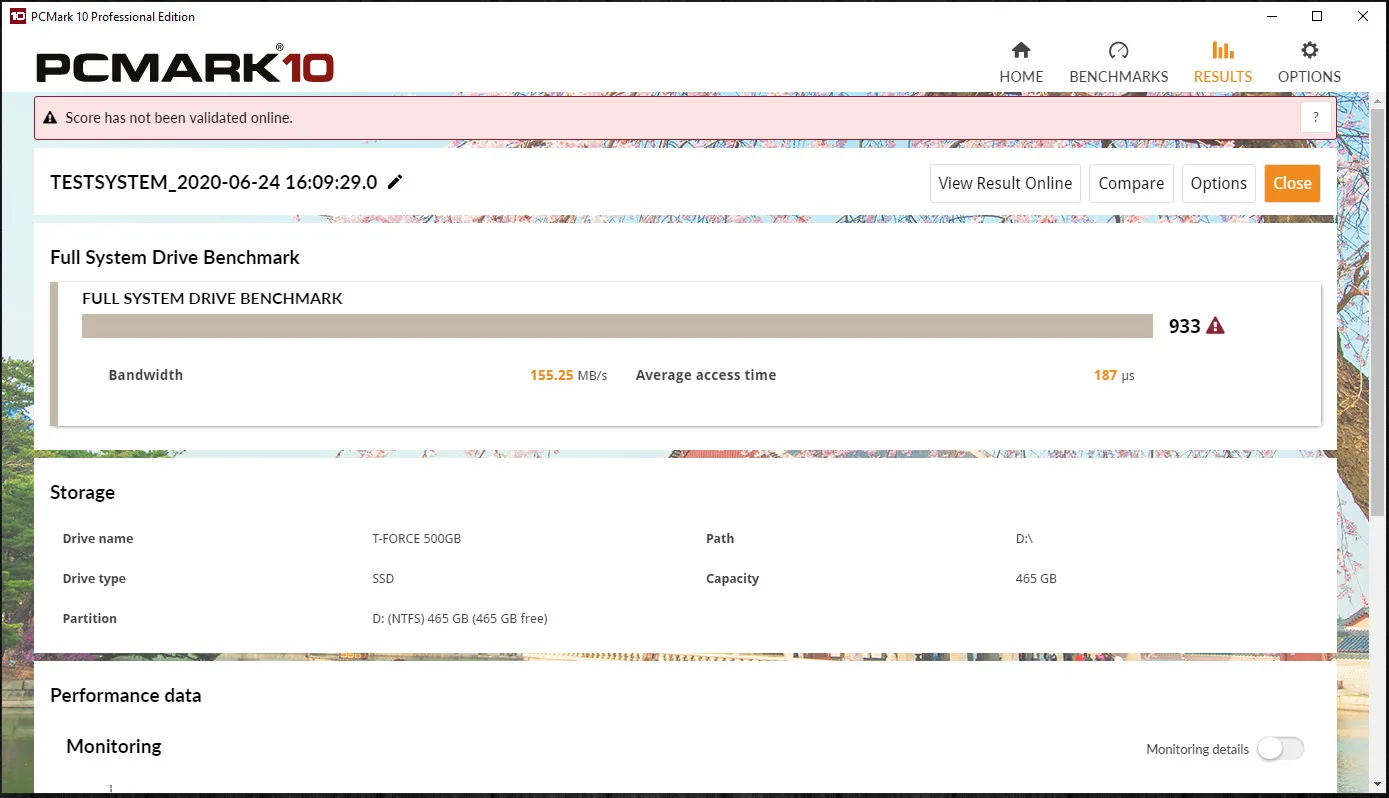
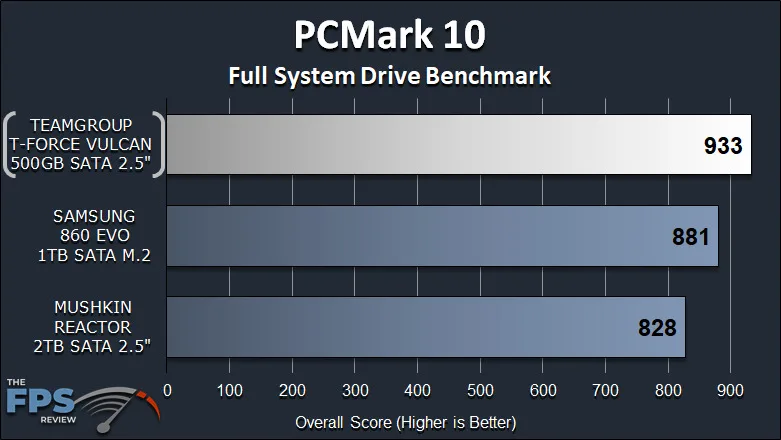
In PCMark 10’s Full System Drive Benchmark the new TeamGroup T-Force Vulcan 500GB SSD is on top in performance with an overall score of 933. In this system drive benchmark, which takes many factors into account in regards to the SSD performance, has a very positive result with this new SSD from TeamGroup. The Samsung 860 EVO 1TB SSD seems to come in second, under the TeamGroup T-Force Vulcan SSD. The TeamGroup Vulcan SSD scores 6% better than the Samsung 860 EVO. At the bottom is the Mushkin Reactor 2TB SSD with a score of 828. Compared to the Mushkin Reactor SSD the TeamGroup T-Force Vulcan SSD has a score that is 13% higher.
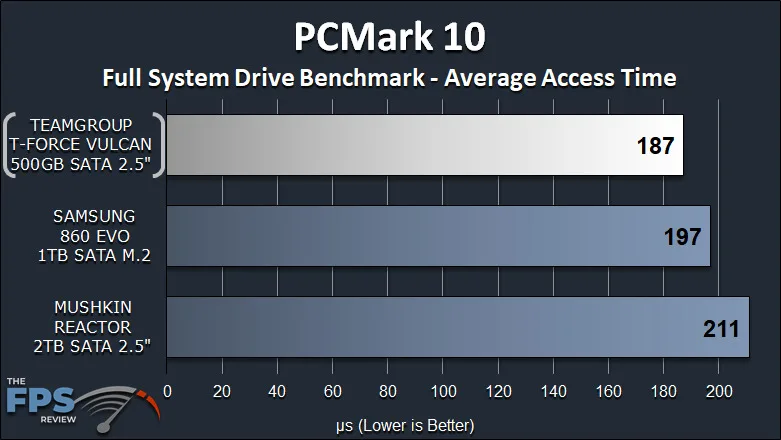
Another factor that PCMark 10 full-system drive benchmark tests is the average access time. Naturally, you want this to be faster, so lower is faster. Once again the TeamGroup T-Force Vulcan SSD is on top here again with a lower access time of 187 microseconds. The Samsung 860 EVO is second at 197 microseconds and the Mushkin Reactor is last at 211 microseconds. This shows that the TeamGroup SSD is simply faster at accessing data.
PassMark PerformanceTest 10.0
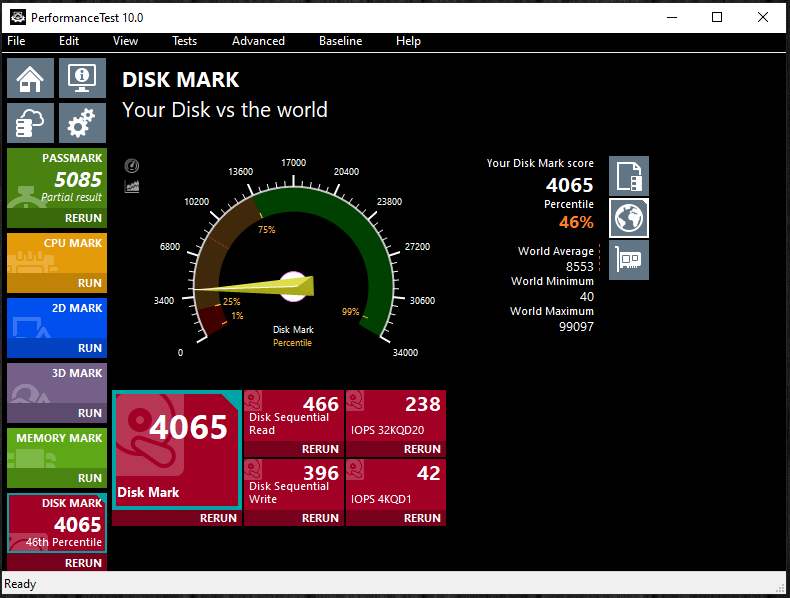
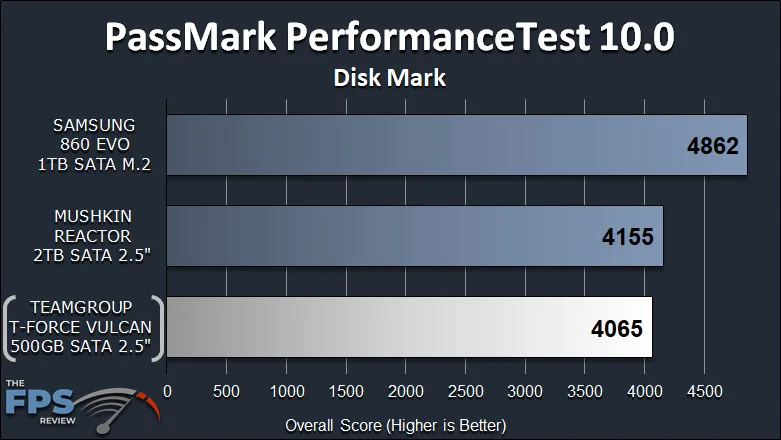
For this test, we are using just the Disk Mark benchmark full run from PassMark PerformanceTest 10.0. In the graph, this benchmark puts the TeamGroup T-Force Vulcan SSD in the last place at 4065 total score. The Mushkin Reactor is second at 4155 and the SAMSUNG 860 EVO is at the top at 4862. These are overall scores, not actual performance. Looking closer at the results, it seems the TeamGroup T-Force Vulcan SSD scored lower in the write tests, specifically Disk Sequential Write, IOPS 32KQD20, and IOPS 4KQD1.
This low-performance score is not replicated in the other benchmarks as you will see that follow. In fact, the SSD was on top in PCMark 10. Therefore, I wouldn’t be too concerned with the results in this particular benchmark and would take the results with a grain of salt. We just wanted to include it to be thorough and transparent with the results we saw in this benchmark.