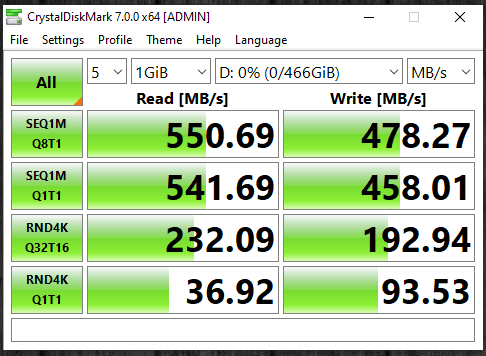
CrystalDiskMark
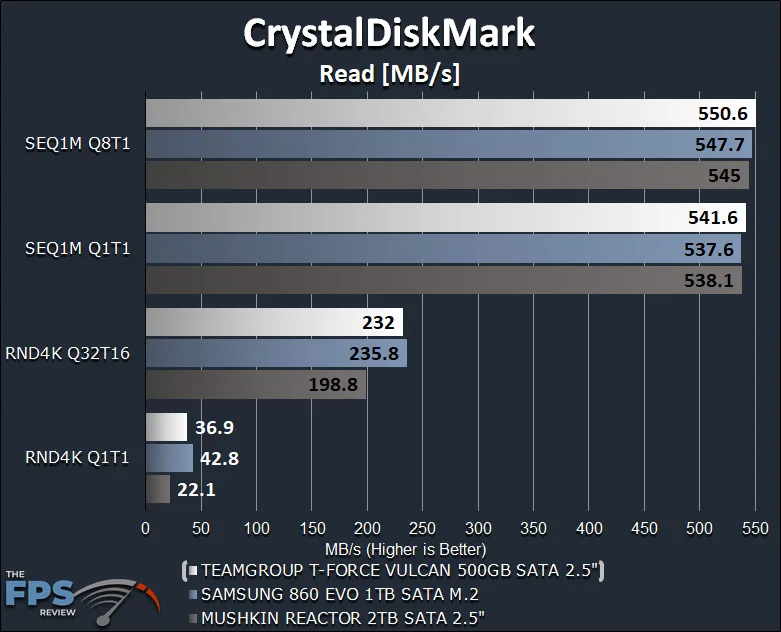
In the graph above we are comparing CrystalDiskMark Read performance only between the three drives. This shows SEQ1M Q8T1, SEQ1M Q1T1, RND4K Q32T16, and RND4K Q1T1 performance. The white bar is the TeamGroup SSD, and the blue bar is the SAMSUNG 860 EVO and the grey bar is the Mushkin Reactor.
The results here are quite positive for the TeamGroup T-Force Vulcan SSD. It has a highest read speed of 550.6 MB/s on SEQ1M Q8T1. Remember, the quoted rated read speed of the SSD by the specs is 560 MB/s, so we are coming very close to its theoretical maximum performance. It actually has a higher read speed than the SAMSUNG 860 EVO in Sequential Reads across the board! That’s pretty amazing since the SAMSUNG drives are often known for their performance.
It’s also much faster than the Mushkin SSD in Random Reads, and almost on par with the SAMSUNG 860 EVO, very close. It really blows the doors off the Mushkin drive though, offering much better random read performance.
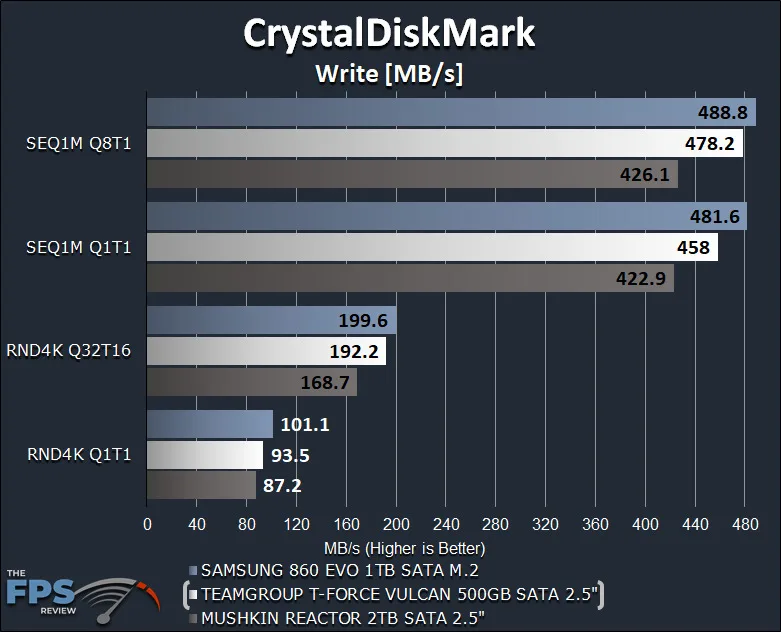
Now we are looking at the sequential and random write performance. On these tests, we do see a write advantage across the board on the SAMSUNG 860 EVO SSD. It achieves up to 488 MB/s. However, the TeamGroup T-Force Vulcan SSD is not really that far behind, hitting a maximum of 478.2 MB/s write. The TeamGroup T-Force Vulcan SSD is also way faster on write speeds compared to the Mushkin Reactor SSD. It has improved write speeds across the board compared to that SSD which maxed at 426 MB/s.
At 478.2 MB/s we are only around 30 MB/s shy of the theoretical maximum of 510 MB/s write. It should also be noted that the SAMSUNG 860 EVO at 488.8 MB/s is also about 30 MB/s shy of its theoretical 520 MB/s write speeds in sequential.
Therefore, both are equally shy of their maximum in this particular benchmark, so in that sense, you could say they are hitting the max writes. In fact, you’ll notice both are exactly 10 MB/s apart, which just so happens to be the difference in theoretical maximums between both (510MB/s on the TeamGroup and 520MB/s on the SAMSUNG.) In other words, both are hitting their max, and the writes are really good on both SSDs.
Anvil’s Storage Utilities
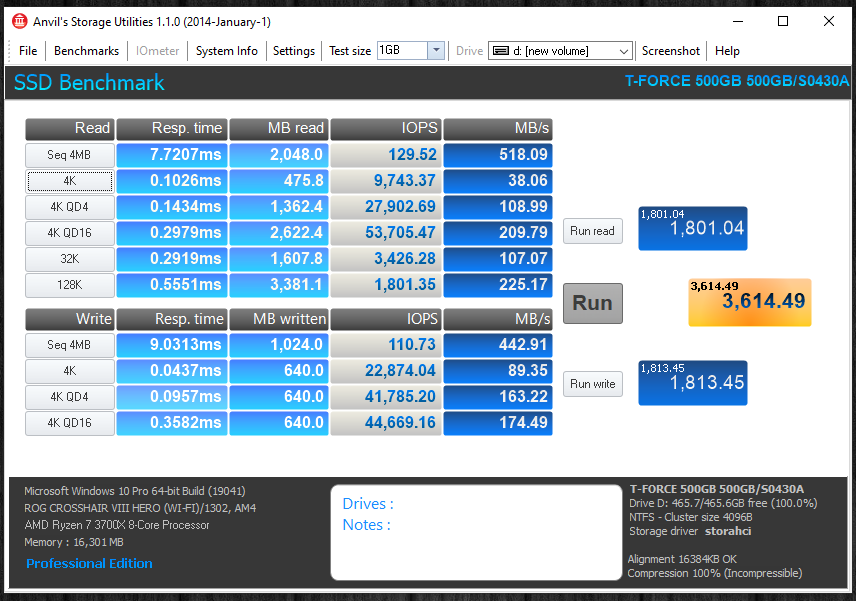
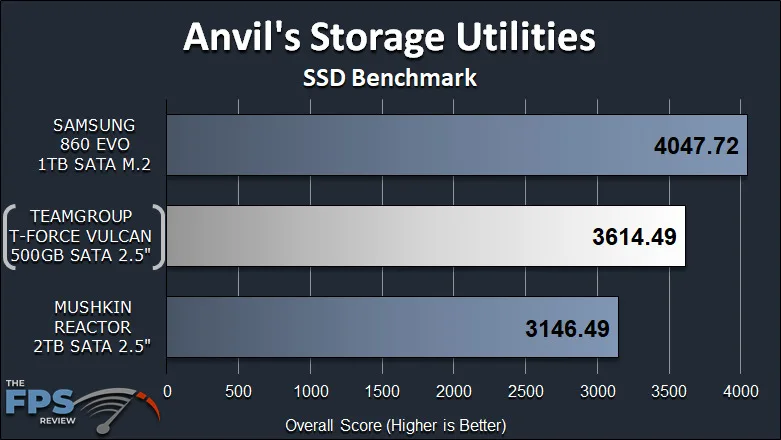
In the above graph is the overall total score from Anvil’s Storage Utilities benchmark. You will find the SAMSUNG 860 EVO is on top with a score of 4047, but the TeamGroup T-Force Vulcan SSD is close behind at 3614 total score. The TeamGroup T-Force Vulcan SSD beats the Mushkin Reactor SSD a great deal. The wins for the SAMSUNG 860 EVO are mainly in the write results.