Application Benchmarks
We are going to start with application and system benchmarks for comparisons, these are the kind of benchmarks that provide an overall performance score to compare with. These are also benchmarks that may either test the system as a whole, including many different real-world workloads or stress the CPU in ways real-world everyday workloads are performed to produce a performance result.
Geekbench 5
Geekbench 5.1.1 was used for this test. It is a multi-platform test that is comparable across different CPU architectures.
Single Core
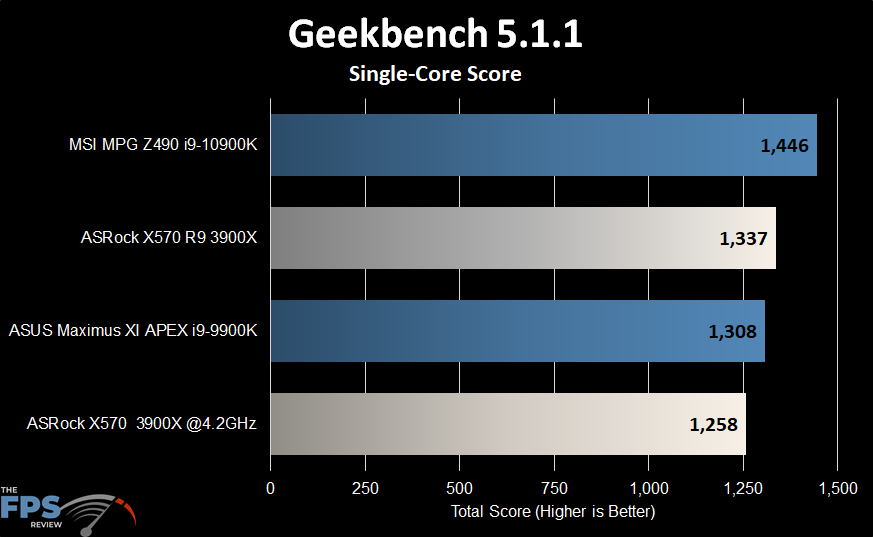
Unsurprisingly, the overclocked results are worse than the stock ones in this single threaded test. We see a result of 1,337 (not a typo or a joke), at stock and 1,258 overclocked.
Multi-Core Score
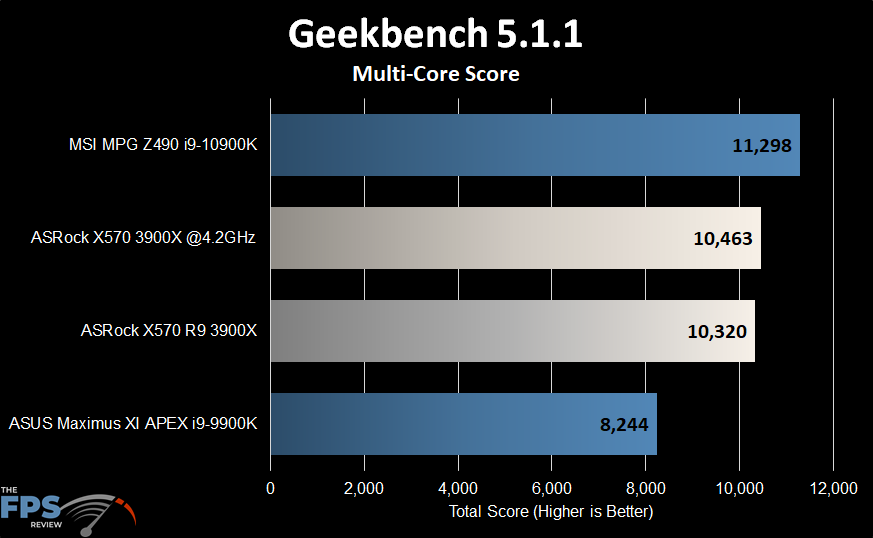
In this test, the ASRock X570 Creator scores almost the same when the CPU is at stock or overclocked speeds, coming in at 10,463 and 10,320 respectively.
AIDA64 CPU Queen
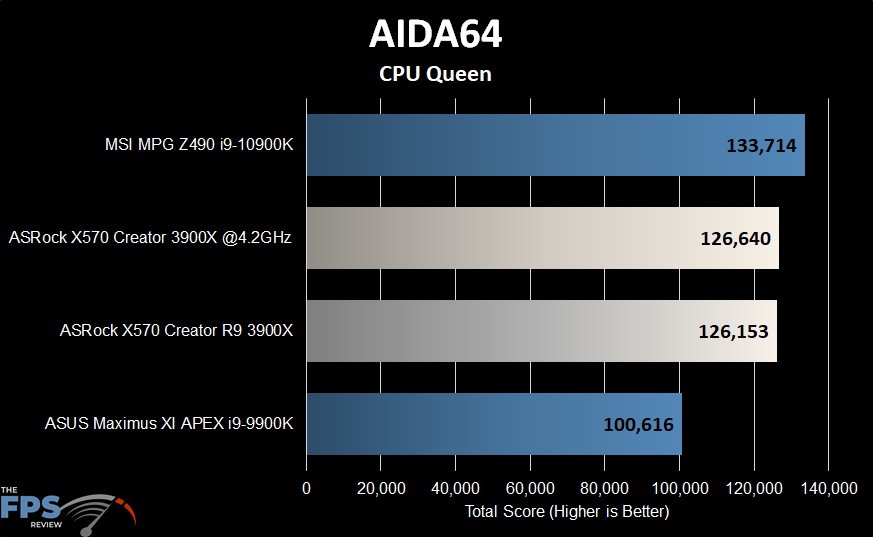
AIDA64’s CPU Queen test tests branch prediction, which is a little better on the Intel side. However, we see very strong results from the ASRock X570 Creator. Interestingly, the 3900X gains almost nothing when overclocked to 4.2GHz on all cores.
SiSoft Sandra
We used SiSoftware Sandra version 2020.5.30.41 for all Sandra testing. The processor arithmetic Dhrystone and Whetstone performance results are represented in GFLOPS.
Dhrystone
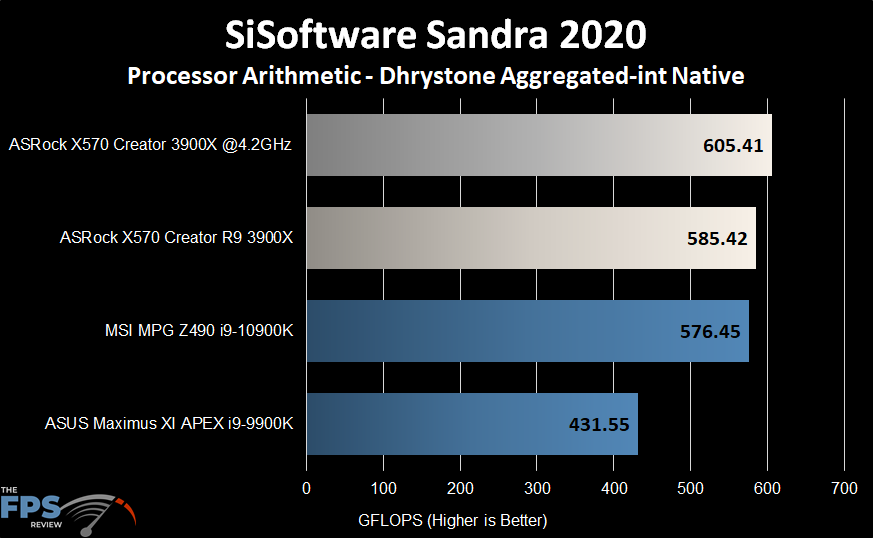
Here we see a score of 605.41GFLOPS when overclocked and 585.42GFLOPS at stock speeds. The ASRock X570 Creator does precisely what it’s supposed to, and the numbers are basically what we expected.
Whetstone
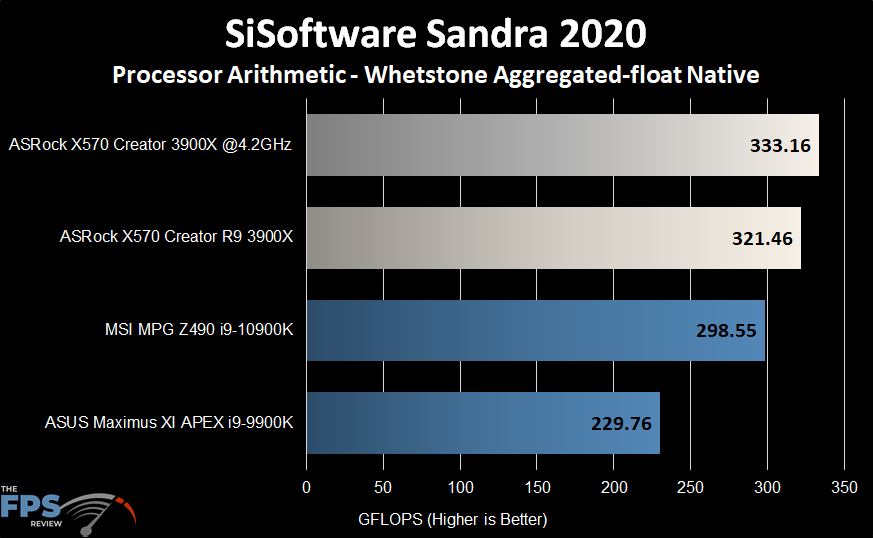
Overclocking with the X570 Creator and our 3900X provides some slight gains, increasing the score from 321.46GFLOPS to 333.16GFLOPS.
wPrime
Version 2.10 was used. We also ran the 1024m test for each test configuration with the appropriate thread count.
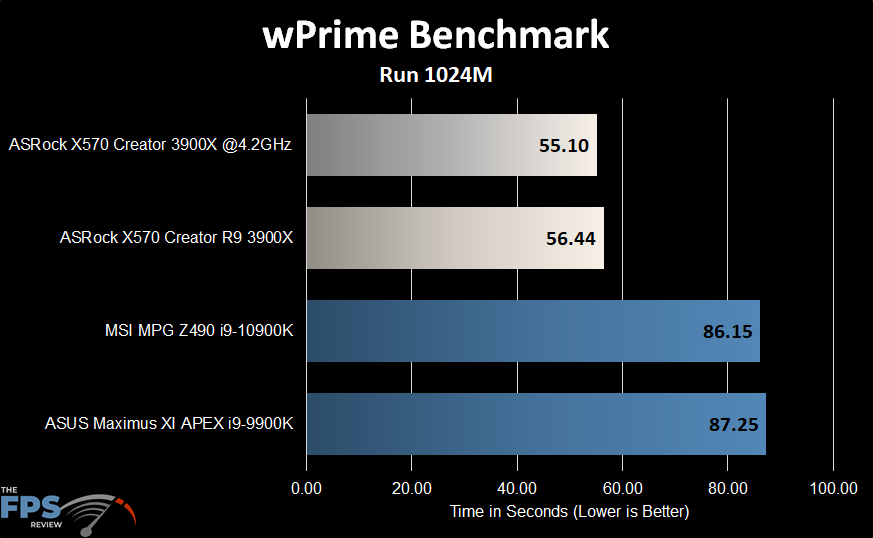
We see another increase through overclocking, albeit much smaller in the wPrime test than the Sandra CPU tests. Here, Intel simply can’t compete with AMD’s core/thread count advantage.
WinRAR Benchmark
WinRAR 5.90 was used. We are looking at the KB/s that each CPU can process.
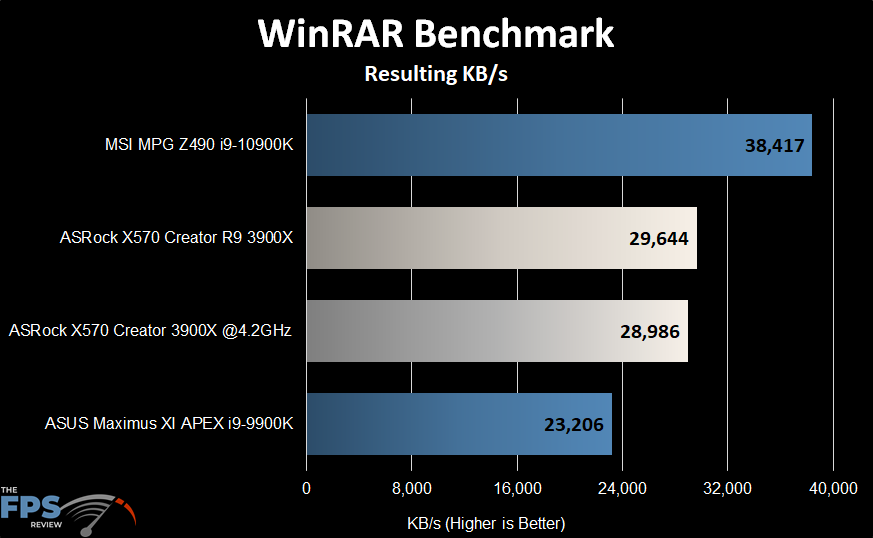
WinRAR has always been a weird test. You see gains from both clock speed and additional threads, but there seems to be a point of diminishing returns on thread count, where the increases to clock speed make more of a difference. Hence, Intel’s general dominance in this test.