Rendering Benchmarks
Here, we are looking at each CPU’s ability to perform rendering and encoding tasks.
Cinebench R20 Multithread
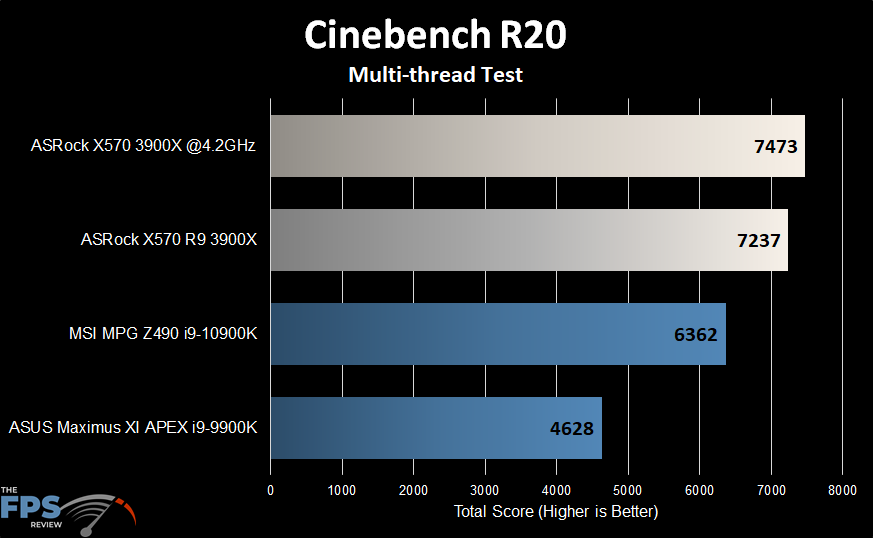
In the Cinebench R20 test, we see the results of 7473 overclocked and 7237 stock. Compared to both Intel processors, the gap is enormous. Although its interesting to note Intel’s improvement in only one generation.
Cinebench R20 Single Thread
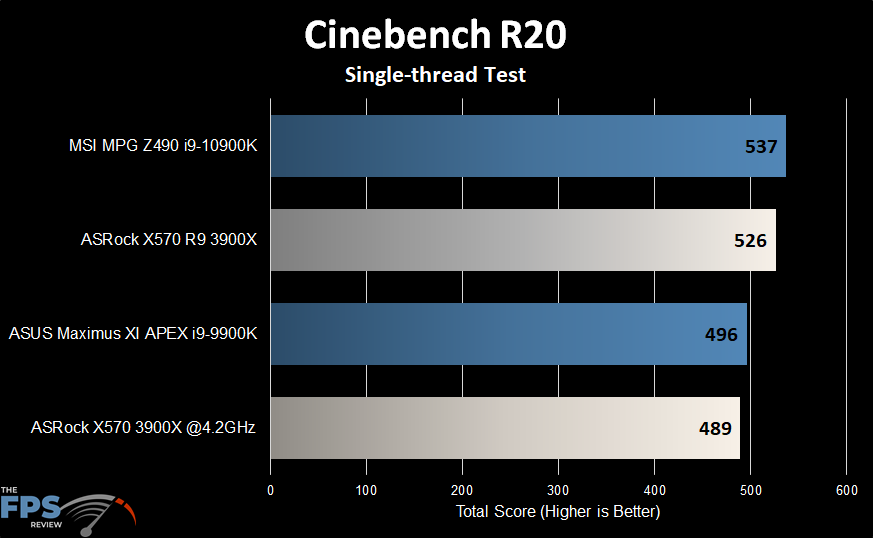
This is another case that sort of proves the idea that an all core manual overclock on a Ryzen CPU is generally not a good idea. That’s not entirely accurate, but it seems to be the case on these higher core count CPU’s as evidenced by the massive hit you take to boost clocks for single-threaded applications. Stock, we see a result of 526 compared to 489 using a 4.2GHz all-core overclock.
Blender Open Data Benchmark
This is the Blender Open Beta Benchmark version 2.04. This Blender Benchmark allows you to download multiple demos for rendering and render up to six of them in sequence. This can take an extremely long time to run all of them. You also have the option of testing different versions of Blender from the same launcher. We chose two of the tests out of the six, which seemed to have a longer run time than the others.
Blender pavilion_barcelona
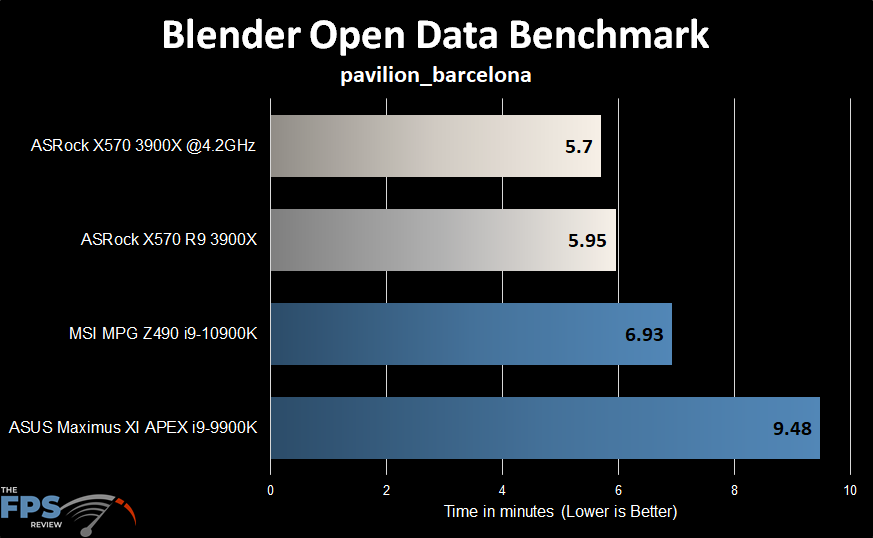
In this test, the X570 Creator achieves scores of 5.7 minutes overclocked and 5.95 minutes stock.
Blender Victor
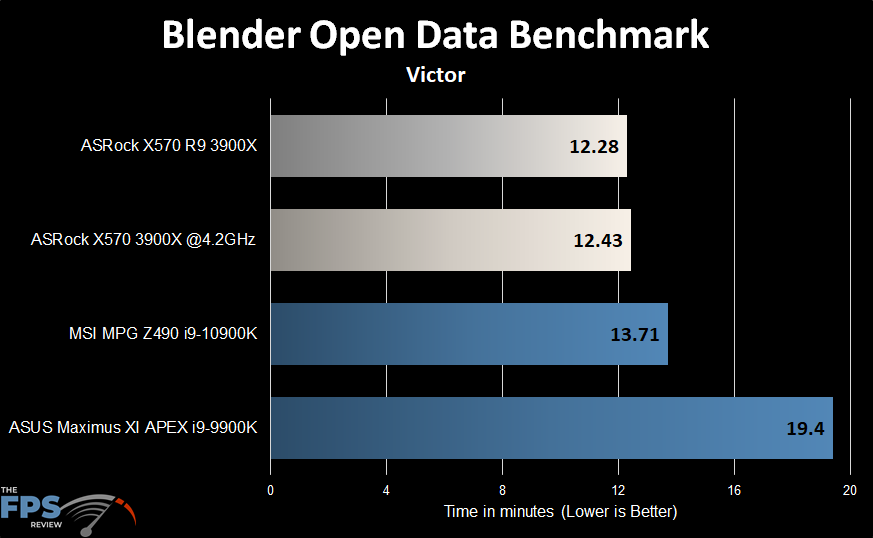
In this test, we see results of 12.28 minutes at stock speeds and 12.43 minutes overclocked. Comparatively, Intel’s best offering only achieves a result of 13.71 minutes.
V-Ray Benchmark
V-Ray 4.10.07 was used for this test.
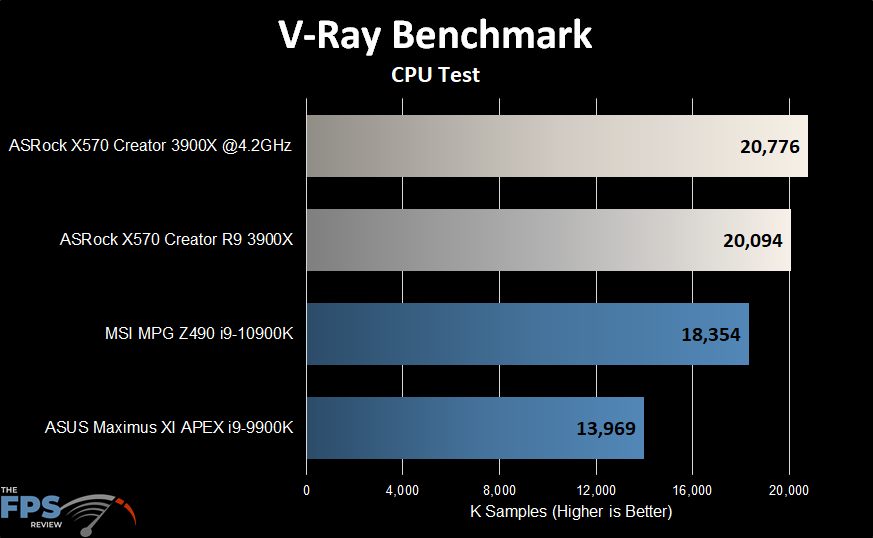
In this test, the X570 Creator achieves results of 20,776 overclocked and 20,094 K samples at stock speeds. In contrast, Intel’s Core i9-10900K only achieves a result of 18,354 K samples.
Handbrake
This is an encoding using the 1080P fast 30 preset. The only changes made to the application were disabling of GPU acceleration. The video was a 4K video at 4 minutes and 42 seconds in length.
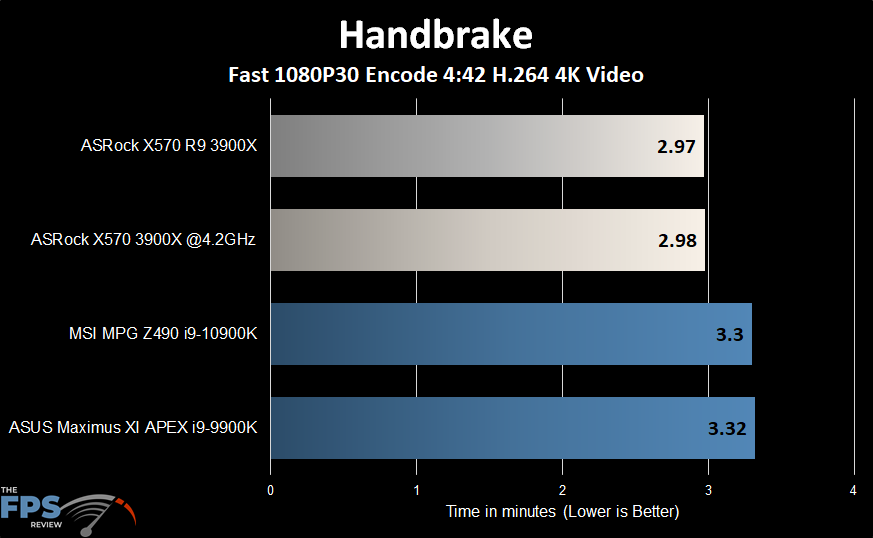
The X570 Creator manages to beat out the MSI MPG Z490 by a healthy margin. Obviously, due to the processor’s increased core and thread count. Overclocked, the results are almost identical to those of a stock 3900X in this test.
POV-Ray 3.7
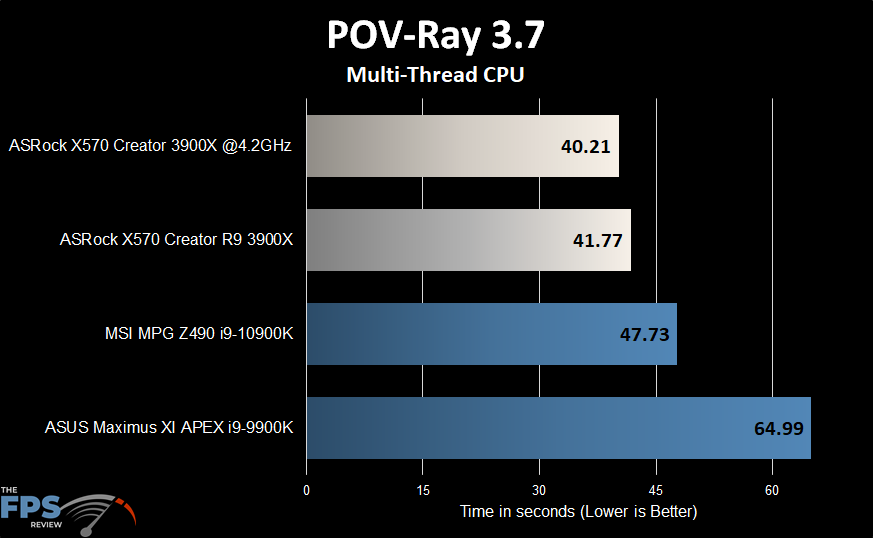
In POV-Ray, the X570 Creator achieves scores of 40.41 seconds overclocked and 41.77 seconds at stock speeds. Comparatively, the 10900K only achieves a result of 47.73 seconds while the 9900K turns in the only time over the 1-minute mark.