PCMark 10 and Geekbench
We are now going to show our synthetic benchmark testing first, and then game performance will follow afterward. On all the graphs you will note that under “Intel Core i9-11900K” there is an “A.B. On” or “A.B. Off.” This indicates whether either Intel Adaptive Boost is On or Off. A.B. = Adaptive Boost as set by the BIOS.
As you look at the results, keep in mind that price-wise the i9-11900K matches the Ryzen 9 5900X. However, by core count, the i9-11900K at 8c/16t matches the Ryzen 7 5800X at 8c/16t. The i9-10900K is a 10c/20t CPU.
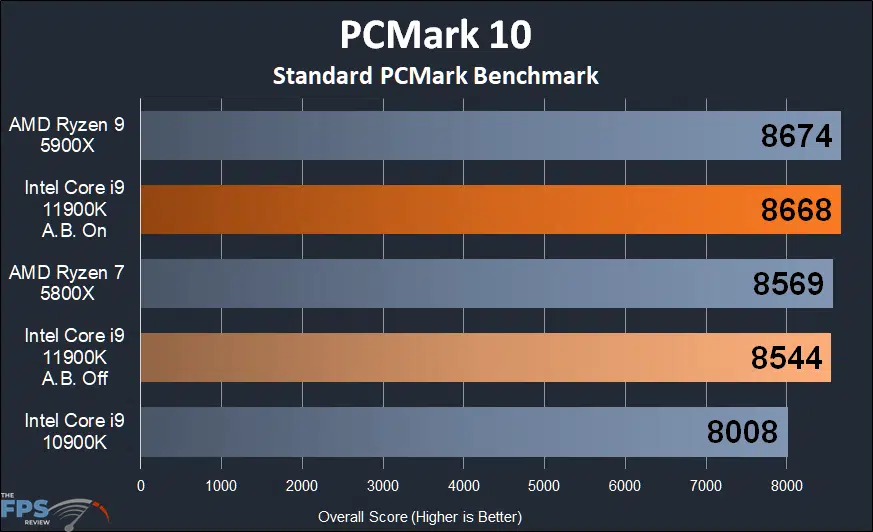
PCMark 10
Standard PCMark Benchmark

In this first graph, we are looking at PCMark 10 standard benchmark test, which is an overall system test. PCMark 10 runs a gauntlet of different office, content creation, and desktop workloads. Typical, non-gaming stuff. According to this graph, we can firstly see that turning on Adaptive Boost does improve performance. With Adaptive Boost off, which is the default, performance falls behind the AMD Ryzen 7 5800XT. Once Adaptive Boost is enabled, it now edges out the 5800X ever so slightly. The AMD Ryzen 9 5900X takes the lead in performance though. What is worth looking at though is how much the new i9-11900K improves upon the i9-10900K with or without Adaptive Boost.
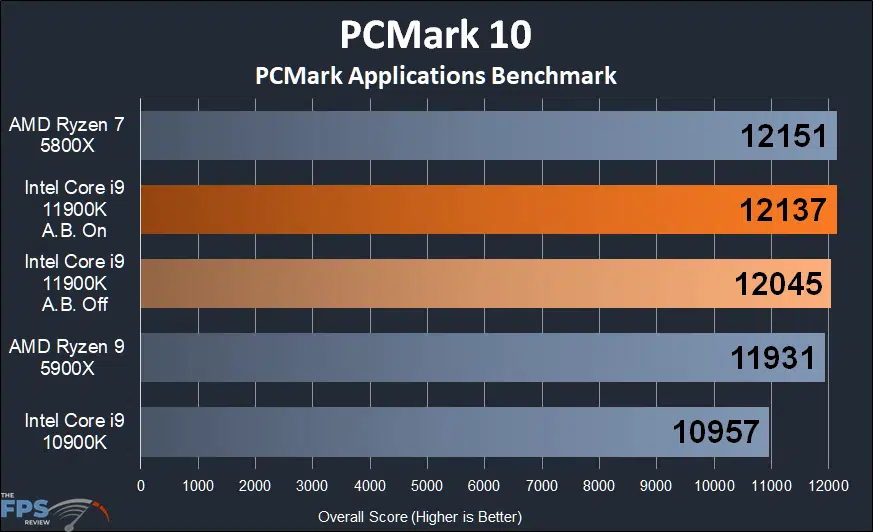
PCMark Application Benchmark

In this graph, we are looking at PCMark 10’s Applications Benchmark. This test is very specific, it tests the performance of Microsoft Office, using Excel, Word, PowerPoint and even Explorer. We have found this test to be rather sensitive to clock speed instead of core count. This is why you see the Ryzen 7 5800X and i9-11900K with Adaptive Boost on top in terms of performance. They have higher sustainable clock speeds at full-load, and thus really perform well here. It seems the 5800X and i9-11900K with A.B. enabled are rather equal in performance here.
The 5900X is toward the bottom because of its lower all-core frequencies. However, once again the new i9-11900K has improved upon the older i9-10900K quite a bit. The new CPU would provide better Microsoft Office performance according to this test.
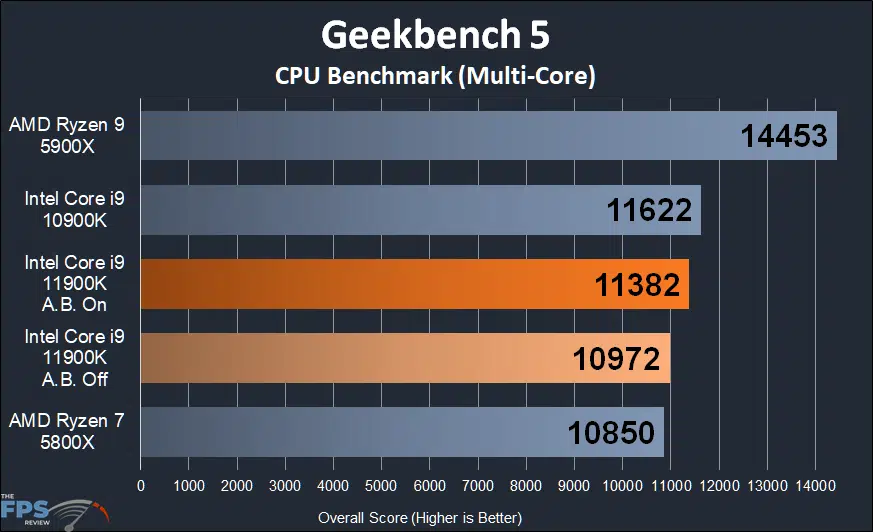
Geekbench 5

Next up we have the latest version of Geekbench 5. This benchmark tests overall CPU performance and can show us a result in both multi-core and single-core performance. In the graph above we have the multi-core performance. This test is obviously very multi-core sensitive and aware. The AMD Ryzen 9 5900X with its 12c/24t count just flies past everything. It’s 27% faster than the Intel Core i9-11900K with Adaptive Boost enabled. Even though this test is multi-core sensitive, Adaptive Boost did provide a 4% performance improvement on the i9-11900K. This was enough to overcome the Ryzen 7 5800X interestingly. The i9-11900K even without Adaptive Boost slightly edges out the 5800X in performance here.

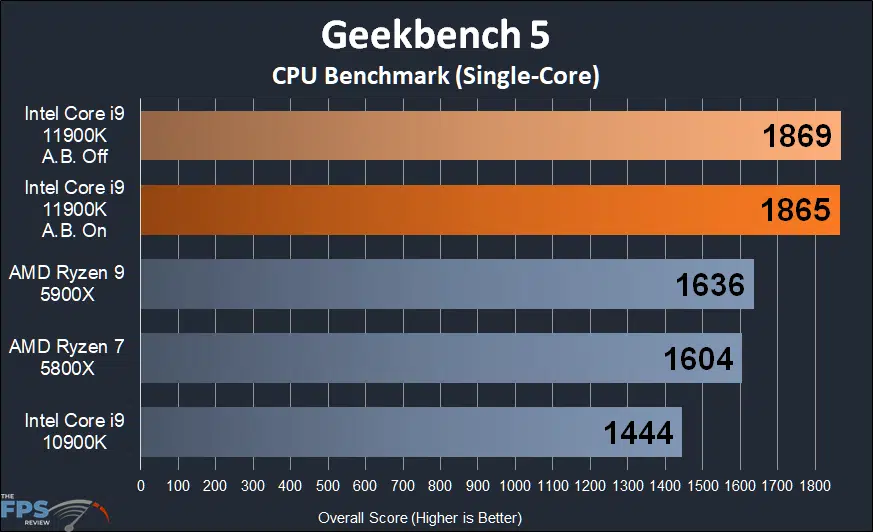
In this graph, we are now looking at single-core performance. This one is really interesting, as it appears that in terms of single-core performance the Intel Core i9-11900K is superior by a long shot to everything else. Even without Adaptive Boost, it’s beating the Ryzen 9 5900X, and Ryzen 7 5800X for single-core performance. Compared to the Ryzen 7 5800X the i9-11900K is 17% faster in single-core performance in this benchmark.
