Synthetic System Benchmarks
On this page, we will show synthetic benchmarks, some that test a variety of system use-case scenarios, and others that test specific multi-core and single-core/thread workloads to hone in on performance differences.
3DMark CPU Profile
We are testing 3DMark’s CPU Profile, which tests Thread performance and Single Thread performance; we are reporting both on separate graphs. We can customize the number of threads tested, and have done so to isolate differences.
Max Threads
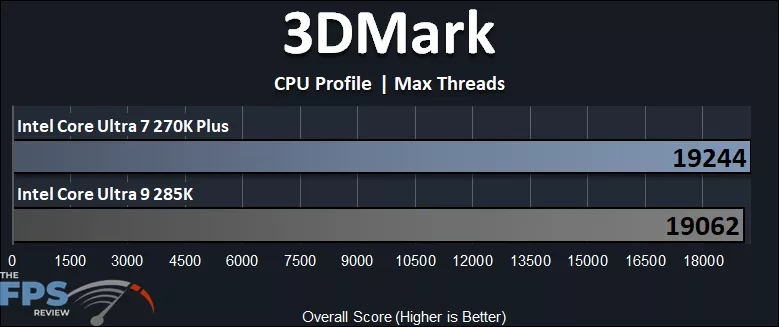
In 3DMark CPU Profile, we have started by setting the test to “Max Threads”, which means it will utilize all 24-threads on both the Intel Core Ultra 7 270K Plus and Intel Core Ultra 9 285K. In this test, we can see that performance is very close, as it is testing the same number of threads. However, due to the improvements in internal frequency and E-Core frequency (despite the 285K having a higher boost), the Intel Core Ultra 7 270K Plus is 1% faster than the Intel Core Ultra 9 285K! Sure, it’s hard to call that a noticeable difference, but from a technical perspective, it shows the advantages the Intel Core Ultra 7 270K Plus has compared to the 285K.
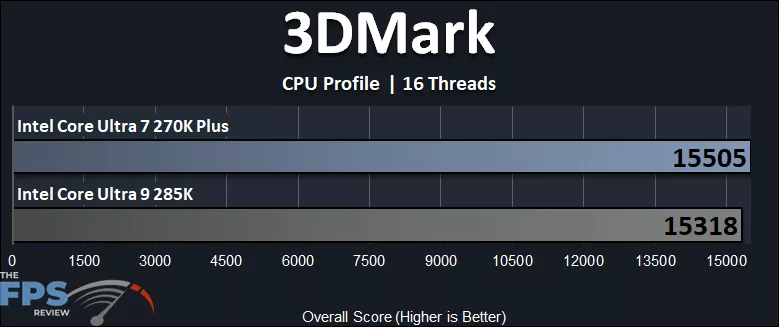
We can customize the settings and now set 16 Threads, and when we do so, once again, both CPUs are very close in performance. The Intel Core Ultra 7 270K Plus is again 1% faster than the Intel Core Ultra 9 285K, not slower, but faster.
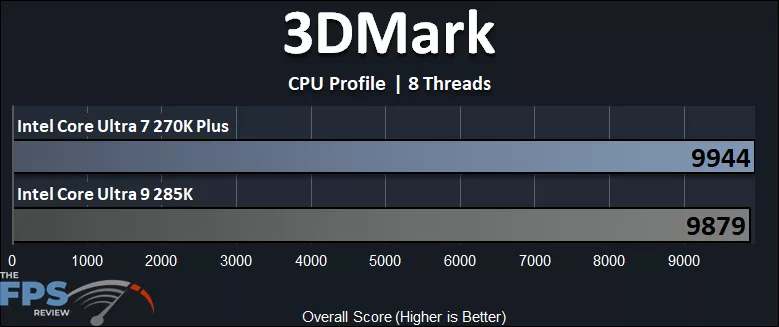
Now we can really hone in more, by reducing the thread count down to 8, therefore putting all the workload on the 8 P-Cores between both CPUs and taking out the E-Cores from the equation. When doing this, the Intel Core Ultra 7 270K Plus is 0.6% faster, slightly less than with the E-Cores, compared to the 285K. Remember, the 285K can boost higher on the P-Cores, but the Intel Core Ultra 7 270K Plus has higher die-to-die frequencies internally, and that pays off here.
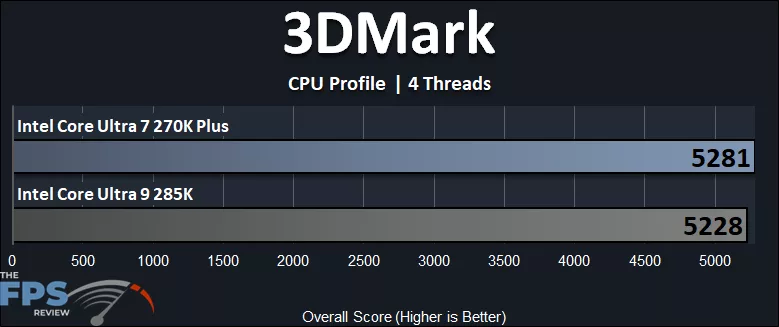
Moving down even further to just 4 Threads, the Intel Core Ultra 7 270K Plus is again 1% faster than the Intel Core Ultra 9 285K.
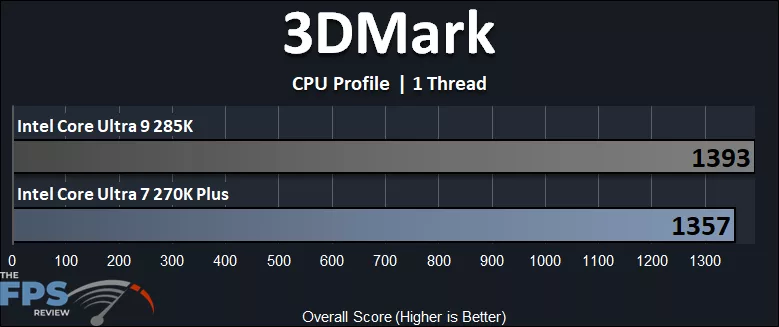
Now for the single-thread or 1 Thread performance testing. When it comes to single-thread performance testing, or single-core, we see the tables reverse, and the Intel Core Ultra 9 285K is now 3% faster than the Intel Core Ultra 7 270K Plus. Or, in other words, the Intel Core Ultra 7 270K Plus is 3% slower than the Intel Core Ultra 9 285K. The reasoning here is that the Intel Core Ultra 9 285K can boost to a higher P-Core single-core frequency with the Thermal Velocity Boost, compared to the Intel Core Ultra 7 270K Plus, thus giving a 3% performance bump for single-thread workloads.
Geekbench 6.7
Geekbench has had an interesting development with the Intel Core Ultra 200S Plus series CPUs as it relates to the Intel Binary Optimization Tool. You can read all about it here, where it goes into detail. Therefore, we are using the newly released Geekbench 6.7 version for all of our testing today. We will show Multi-Core (nT) and Single-Core (1T) performance in separate graphs.
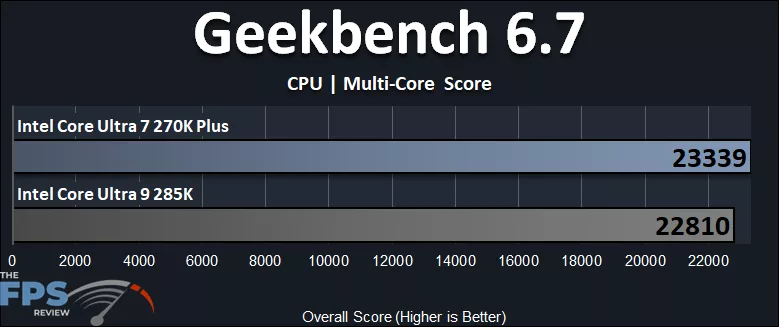
In Geekbench 6.7, the Intel Core Ultra 7 270K Plus is 2% faster than the Intel Core Ultra 9 285K overall. Geekbench tests a series of generalized workloads, and overall, this is what you can expect for system performance improvements, culminating in the improvements to the E-Core boost clock and internal die-to-die frequencies over the 285K.
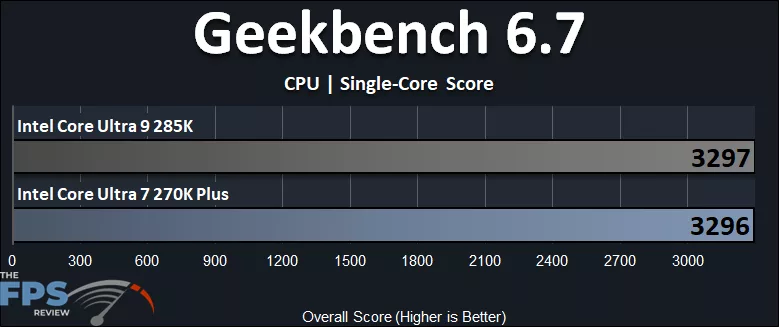
When it comes to the Single-Core score, Geekbench 6.7 reveals that the single-core performance is nearly identical between the Intel Core Ultra 7 270K Plus and the Intel Core Ultra 9 285K.
PassMark PerformanceTEST
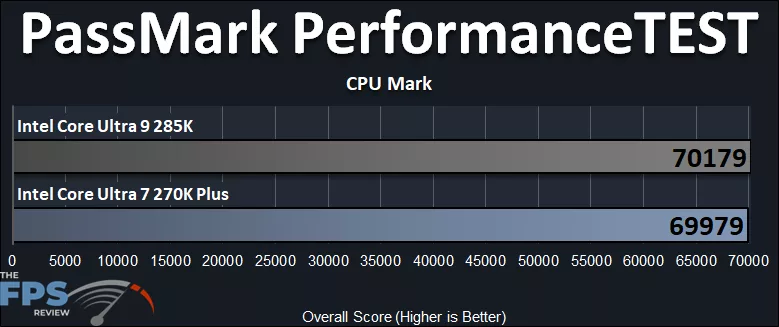
In the PassMark PerformanceTEST CPU Mark benchmark, the performance indicated is mearly 0.2% difference between the two CPUs. In other words, performance is identical between them in this overall system benchmark.
Discussion (1 reply)
Join Discussion →These cpus are an interesting play by Intel to try and claw back users. Good for them!!