Power and Temperature Testing
On this page, we are going to investigate the Intel Core Ultra 7 270K Plus power draw, temperature, and clock speeds. We are going to do this two ways. First, we are going to test while playing a game, under a gaming workload, and then we are going to test under a multi-threading Cinebench 2026 workload. In this way, we can get a feel for the gaming power and temp versus “all core” power and temp. CPU package power and temps are read with HWiNFO64.
Power Testing While Gaming
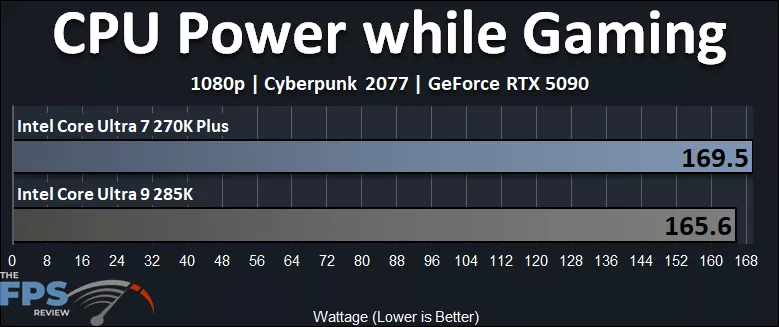
In the graph above, the Intel Core Ultra 7 270K Plus peaked at 169.5W while gaming, while the Intel Core Ultra 9 285K peaked at 165.6W while gaming. This means the Intel Core Ultra 7 270K Plus is pulling only about 4 more Watts or 2% more power than the Intel Core Ultra 9 285K while gaming. Considering we achieved about a 1-2% performance difference, that power scales linearly with the performance improvements in games. That is not much of a difference at all for a better 1% Low game performance.
Power Testing Multi-Threading
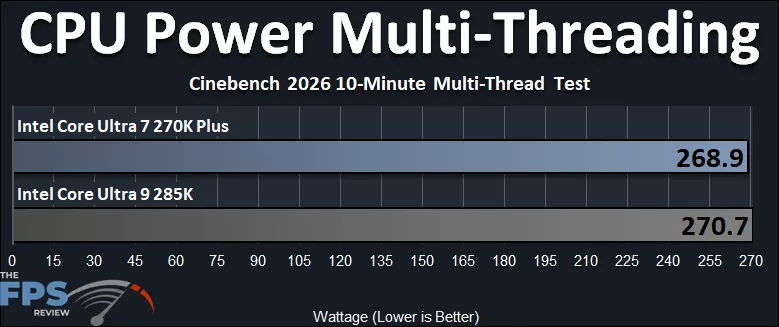
When pushing all-core Wattage, the Intel Core Ultra 7 270K Plus pulls 268.9W, while the Intel Core Ultra 9 285K pulls more at 270.7W. That means the Intel Core Ultra 7 270K Plus actually pulls about 1% less power than the Intel Core Ultra 9 285K when working all the cores at once, despite the E-Cores being clocked faster. This is positive, it means the Intel Core Ultra 7 270K Plus does not consume more power than the Intel Core Ultra 9 285K when working the CPU with an all-core load.
Temperature Testing While Gaming
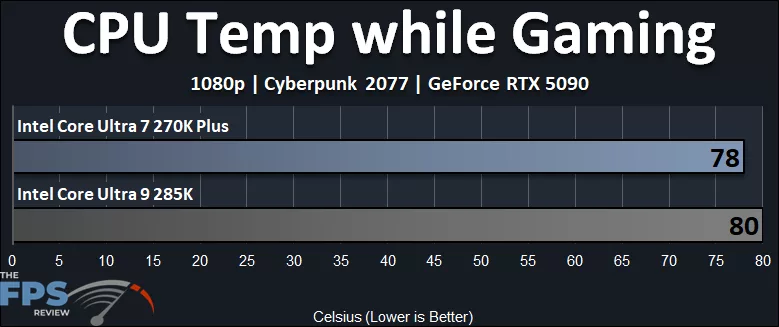
The Intel Core Ultra 7 270K Plus runs about 2 degrees cooler while gaming, compared to the Intel Core Ultra 9 285K. It was pulling about 2% more power while gaming, but actually ran cooler while gaming, so that is certainly an improvement over the 285K.
Temperature Testing Multi-Threading
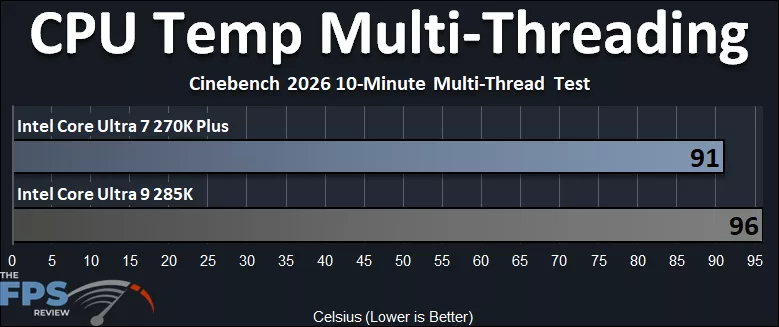
What is really impressive is the temperatures with the all-core workload. The Intel Core Ultra 7 270K Plus actually runs 5 degrees cooler than the Intel Core Ultra 9 285K, which peaks at 96c. This was done with the same 360mm AIO and thermal paste, so the Intel Core Ultra 7 270K Plus really does run slightly cooler, and that’s a big plus.
Intel Core Ultra 7 270K Plus HWiNFO64 Sensor Data
We wanted to show the full HWiNFO64 Sensor Data for both the Intel Core Ultra 7 270K Plus and Intel Core Ultra 7 265KF in our gaming workload, playing a game (left screenshot) and the Multi-Threaded Cinebench 2026 All Core workload (right screenshot), so you can compare the CPUs and clock speeds.
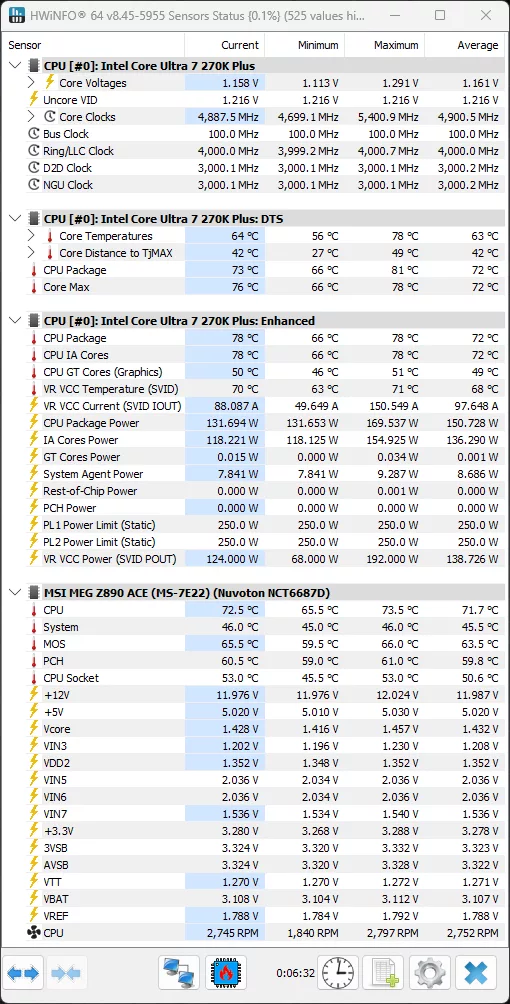
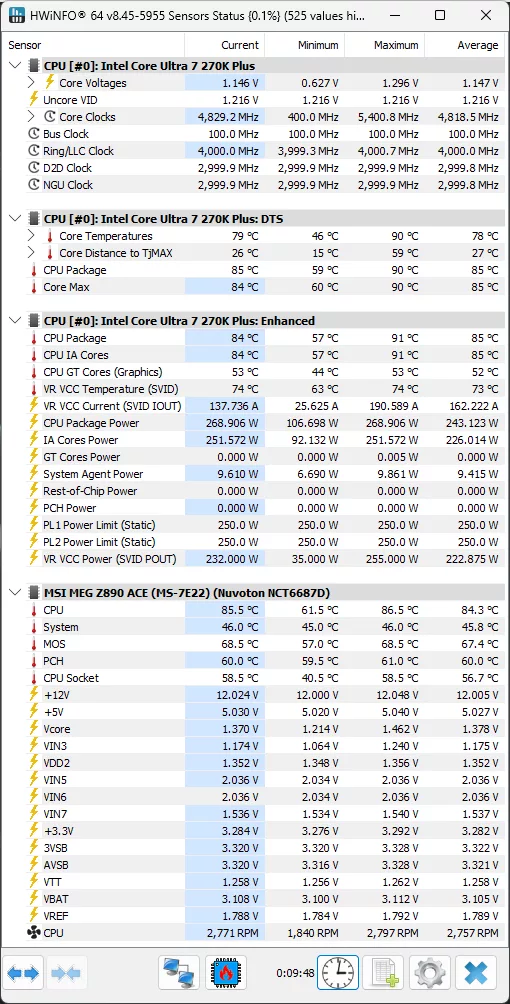
The Intel Core Ultra 7 270K Plus runs up to a maximum of 5.4GHz while gaming, but the average was 4.9GHz while gaming, with the current frequency while in-game at 4.887GHz. You can see how this compares to the 285K below. We can also see that in the Multi-Threading workload, the Intel Core Ultra 7 270K Plus can operate up to 5.4GHz, averaging 4.8GHz, and snapped while mid-workload current was 4.829GHz. You can also see that the Ring/LLC Clock is at 4GHz, the D2D Clock at 3GHz, and the NGU Clock at 3GHz.
Intel Core Ultra 9 285K HWiNFO64 Sensor Data
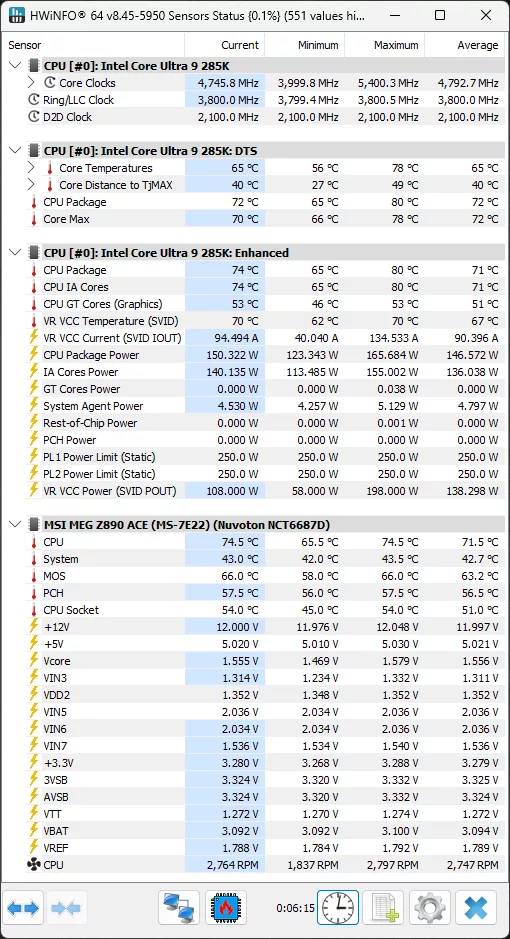
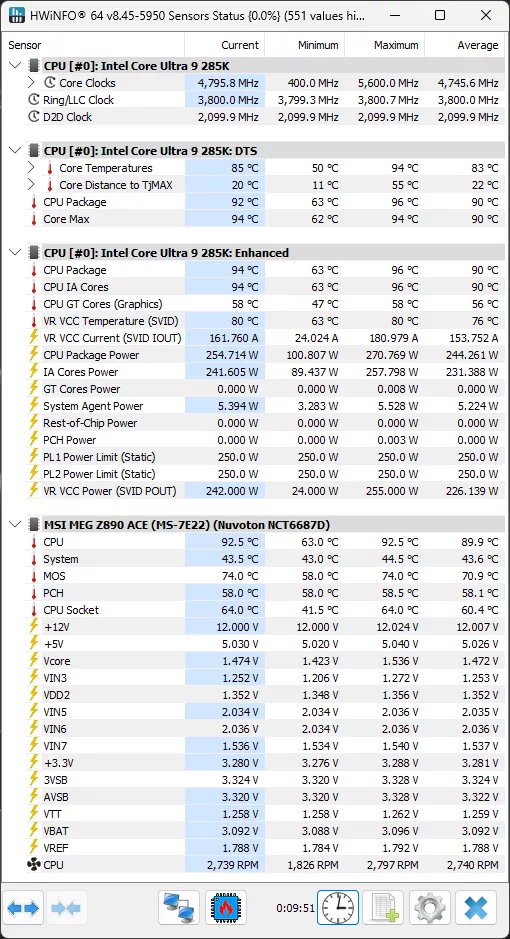
The Intel Core Ultra 9 285K runs up to a maximum of 5.4GHz while gaming, but the average was 4.792GHz while gaming, with the current frequency while in-game at 4.745GHz. You can see how this compares to the 270K Plus above. We can also see that in the Multi-Threading workload, the Intel Core Ultra 9 285K can operate up to 5.6GHz, averaging 4.745GHz, and snapped while mid-workload current was 4.795GHz. You can also see that the Ring/LLC Clock is at 3.8GHz, and the D2D Clock at 2.1GHz.
Discussion (1 reply)
Join Discussion →These cpus are an interesting play by Intel to try and claw back users. Good for them!!