Synthetic System Benchmarks
On this page, we will show synthetic benchmarks, some that test a variety of system use-case scenarios, and others that test specific multi-core and single-core/thread workloads to hone in on performance differences. In all of our graphs to follow, the bars are arranged from the fastest MT/s speed down, so 8800MT/s is on top, with 7200MT/s on the bottom, and this arrangement is locked in independent of the performance shown; they are not arranged by result, but rather the DDR5 memory speed.
AIDA64
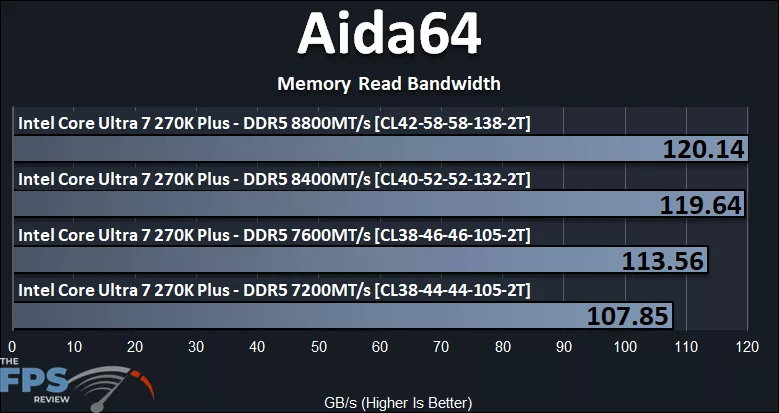
As one would expect in AIDA64’s memory read bandwidth testing, the DDR5 8800MT/s read performance result is the fastest at 120GB/s of bandwidth, with the 7200MT/s being the lowest at 107GB/s. From 7200MT/s up to 8800MT/s, the gain in raw read memory bandwidth is 11%. There is a gain from 7200MT/s to 7600MT/s and then to 8400MT/s, however there is a diminishing returns result moving up to 8800MT/s.
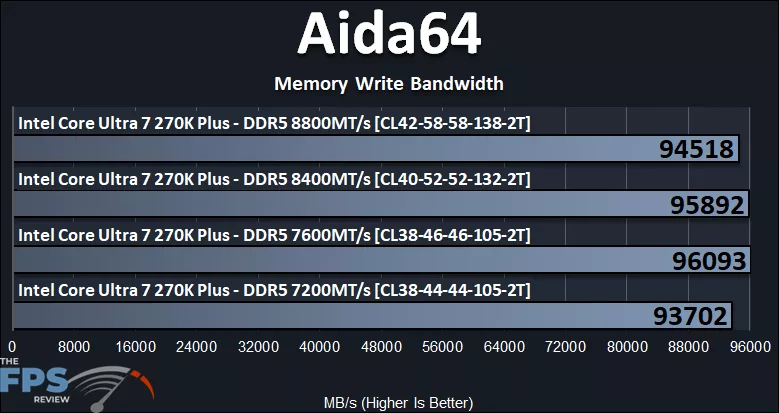
The same cannot be said about memory write bandwidth. Here, the timings seem to affect the result, and the higher timing memory is actually slower than the 7600MT/s profile, with the lower timings being actually the fastest result. The lowest result is the 7200MT/s profile; the difference between the lowest and highest result is only 3%, however, so we are talking very small margins for write bandwidth.
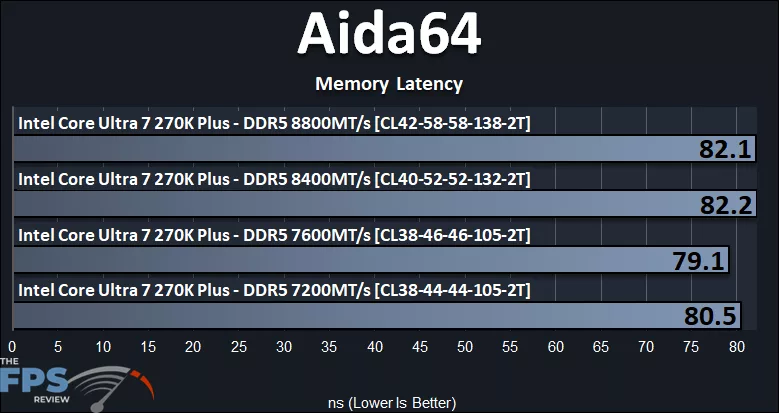
Importantly, we can see the effects that timings have with the higher transfer rate memory. The 8400MT/s and 8800MT/s CUDIMM memory, with the highest timings, have the highest latency of 82ns. The best result is actually the 7600MT/s DDR5 UDIMM at 79ns, and this backs up many of the other results you’ll see in our testing today.
3DMark CPU Profile
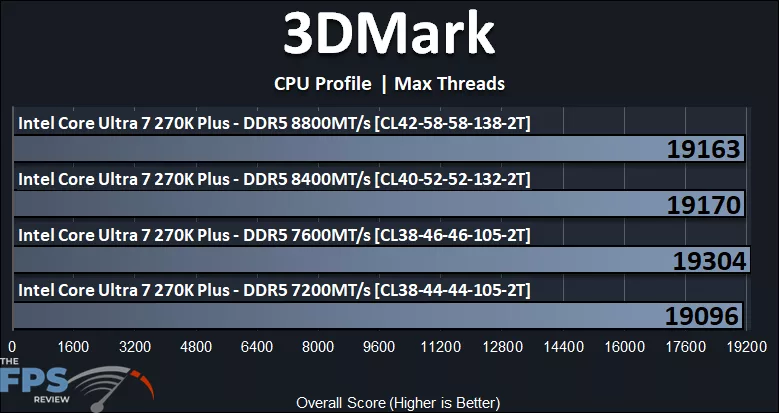
In 3DMark’s CPU Profile test, we are testing the Max Threads CPU performance. The different speed memory does actually cause a different result, and we can see that the 7600MT/s memory with its timings actually yields the highest result. The 8400MT/s and 8800MT/s CUDIMM memory runs slightly faster than the 7200MT/s UDIMM, but slower than the 7600MT/s. Overall, though, we are talking peanuts here; the difference between the highest and lowest performance result is only 1%.
Geekbench 6.7
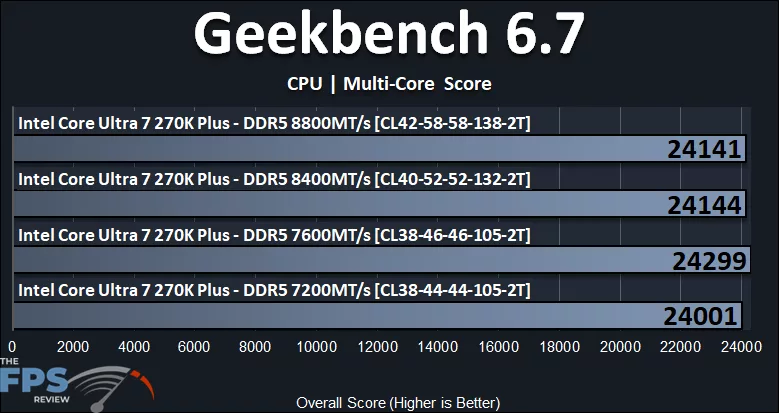
In Geekbench 6.7, we are starting to see a trend with the 7600MT/s UDIMM memory at CL38, as it provides the highest performance result. The 8400MT/s and 8800MT/s sit slightly above 7200MT/s, but under 7600MT/s with their higher timings. Once again, the overall difference is small, with a 1% difference from the smallest result to the highest.
PassMark PerformanceTEST
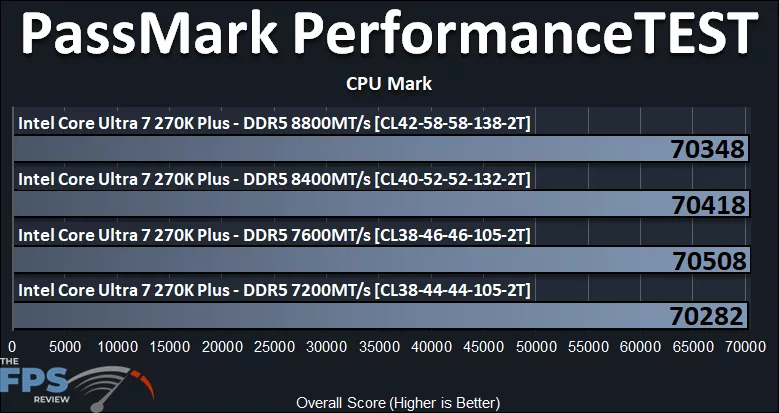
In PassMark PerformanceTEST, the performance is grouped even more tightly together, with no real discernible differences at all between the data. I guess technically, the 7600MT/s UDIMM memory at CL38 is technically the fastest.